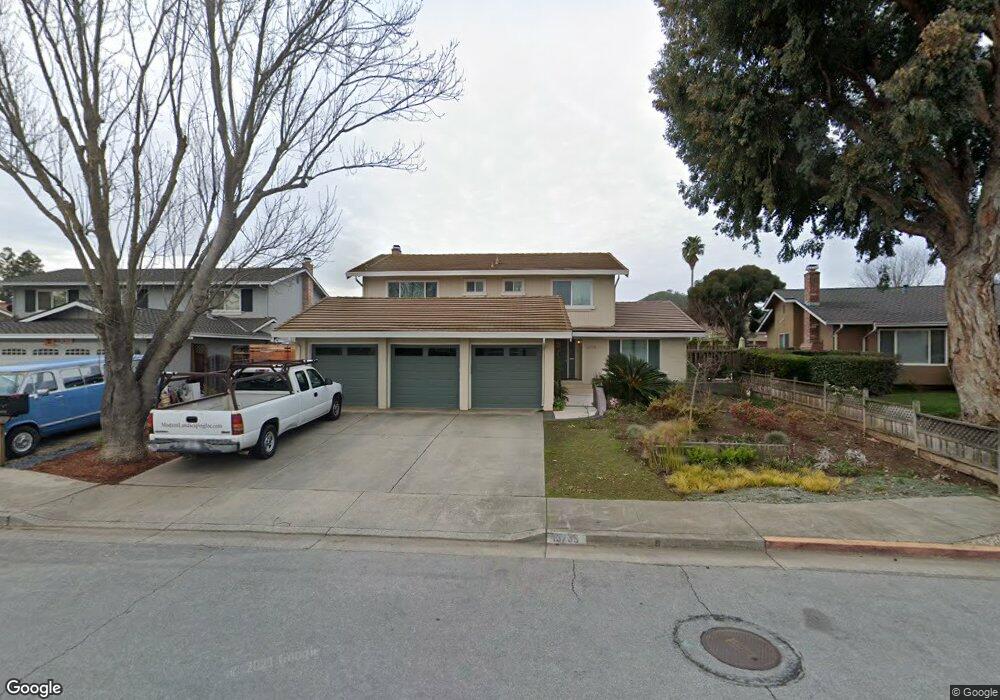
15735 La Jolla Ct Morgan Hill, CA 95037
Estimated Value: $1,468,420 - $1,594,000
5
Beds
3
Baths
2,670
Sq Ft
$573/Sq Ft
Est. Value
About This Home
This home is located at 15735 La Jolla Ct, Morgan Hill, CA 95037 and is currently estimated at $1,530,605, approximately $573 per square foot. 15735 La Jolla Ct is a home located in Santa Clara County with nearby schools including Paradise Valley Elementary, Britton Middle School, and Ann Sobrato High School.
Ownership History
Date
Name
Owned For
Owner Type
Purchase Details
Closed on
May 20, 2015
Sold by
Hertzer Michael and Hertzer Gillian
Bought by
Michael & Gillian Hertzer Living Trust and Hertzer Gillian
Current Estimated Value
Purchase Details
Closed on
Nov 1, 2011
Sold by
Parent Sean and Parent Patricia
Bought by
Hertzer Michael and Hertzer Gillian
Home Financials for this Owner
Home Financials are based on the most recent Mortgage that was taken out on this home.
Original Mortgage
$416,000
Outstanding Balance
$283,672
Interest Rate
4.02%
Mortgage Type
New Conventional
Estimated Equity
$1,246,933
Purchase Details
Closed on
Jul 7, 2005
Sold by
Parent Sean R and Parent Patricia H
Bought by
Parent Sean and Parent Patricia
Purchase Details
Closed on
Jun 30, 1995
Sold by
Urton Perry D and Urton Georgana L
Bought by
Parent Sean R and Parent Patricia H
Home Financials for this Owner
Home Financials are based on the most recent Mortgage that was taken out on this home.
Original Mortgage
$225,600
Interest Rate
7.88%
Create a Home Valuation Report for This Property
The Home Valuation Report is an in-depth analysis detailing your home's value as well as a comparison with similar homes in the area
Home Values in the Area
Average Home Value in this Area
Purchase History
| Date | Buyer | Sale Price | Title Company |
|---|---|---|---|
| Michael & Gillian Hertzer Living Trust | -- | None Available | |
| Hertzer Michael | $520,000 | Chicago Title Company | |
| Parent Sean | -- | -- | |
| Parent Sean R | $282,000 | Old Republic Title |
Source: Public Records
Mortgage History
| Date | Status | Borrower | Loan Amount |
|---|---|---|---|
| Open | Hertzer Michael | $416,000 | |
| Previous Owner | Parent Sean R | $225,600 |
Source: Public Records
Tax History Compared to Growth
Tax History
| Year | Tax Paid | Tax Assessment Tax Assessment Total Assessment is a certain percentage of the fair market value that is determined by local assessors to be the total taxable value of land and additions on the property. | Land | Improvement |
|---|---|---|---|---|
| 2025 | $7,337 | $653,139 | $261,255 | $391,884 |
| 2024 | $7,337 | $640,333 | $256,133 | $384,200 |
| 2023 | $7,241 | $627,778 | $251,111 | $376,667 |
| 2022 | $7,118 | $615,470 | $246,188 | $369,282 |
| 2021 | $6,939 | $603,403 | $241,361 | $362,042 |
| 2020 | $6,771 | $597,217 | $238,887 | $358,330 |
| 2019 | $6,960 | $585,507 | $234,203 | $351,304 |
| 2018 | $6,979 | $574,027 | $229,611 | $344,416 |
| 2017 | $6,912 | $562,772 | $225,109 | $337,663 |
| 2016 | $6,472 | $551,739 | $220,696 | $331,043 |
| 2015 | $6,402 | $543,452 | $217,381 | $326,071 |
| 2014 | -- | $532,807 | $213,123 | $319,684 |
Source: Public Records
Map
Nearby Homes
- 140 La Crosse Dr
- 133 La Crosse Dr
- 605 Encino Dr
- 542 Via Sorrento
- 15180 Venetian Way
- 15120 Venetian Way
- 15145 Bellini Way
- 445 Barrett Ave
- 225 Spring Ave Unit 5
- 136 Vinewood Ln Unit 136
- 199 Leisure Dr Unit 199
- 260 W Dunne Ave Unit 18
- 97 Melody Ln Unit 97
- 92 Melody Ln Unit 92
- 56 Creekside Dr Unit 56
- 952 Blaise Ln Unit 1001
- 42 Dewey Cir
- 16761 San Luis Way
- 924 More Ln
- 924 More Ln Unit 1702
- 15755 La Jolla Ct
- 15715 La Jolla Ct
- 15710 La Mar Ct
- 15690 La Mar Ct
- 15730 La Mar Ct
- 15775 La Jolla Ct
- 15695 La Jolla Ct
- 15670 La Mar Ct
- 15750 La Mar Ct
- 15710 La Jolla Ct
- 15760 La Jolla Ct
- 15795 La Jolla Ct
- 15675 La Jolla Ct
- 15770 La Mar Ct
- 15780 La Jolla Ct
- 215 La Crosse Dr
- 15650 La Mar Ct
- 205 La Crosse Dr
- 15705 La Mar Ct
- 15725 La Mar Ct