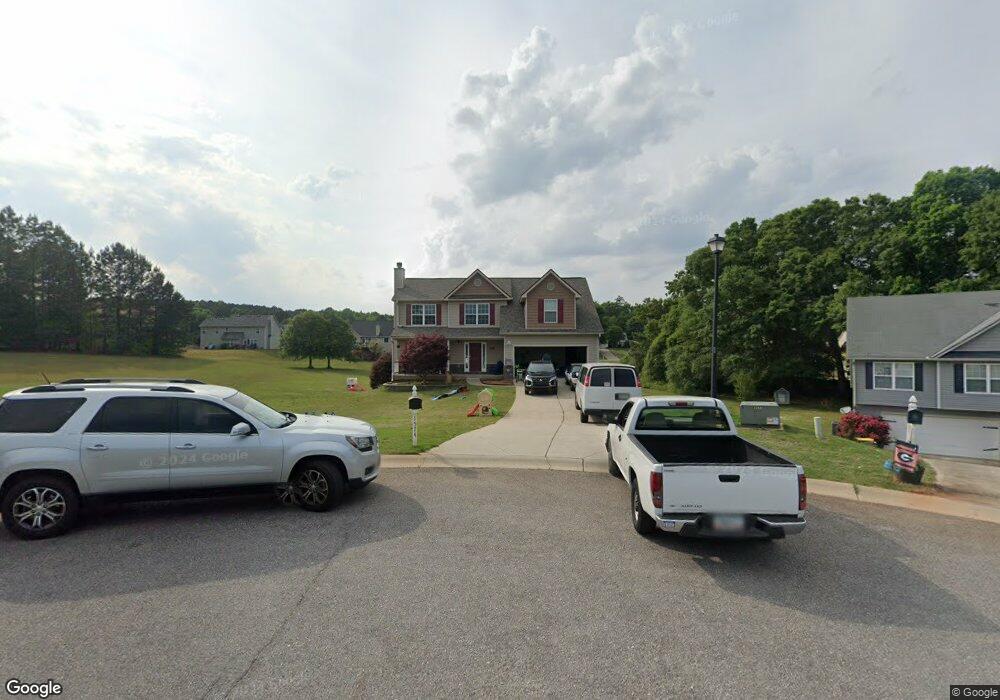
1574 Tyler Ct Unit LOT 56 BLK A PB 56-1 Winder, GA 30680
Estimated Value: $355,000 - $365,000
4
Beds
3
Baths
2,424
Sq Ft
$149/Sq Ft
Est. Value
About This Home
This home is located at 1574 Tyler Ct Unit LOT 56 BLK A PB 56-1, Winder, GA 30680 and is currently estimated at $360,075, approximately $148 per square foot. 1574 Tyler Ct Unit LOT 56 BLK A PB 56-1 is a home located in Barrow County with nearby schools including Statham Elementary School, Bear Creek Middle School, and Winder-Barrow High School.
Ownership History
Date
Name
Owned For
Owner Type
Purchase Details
Closed on
Feb 1, 2021
Sold by
Walton Jeremy S
Bought by
Attard Steven Robert
Current Estimated Value
Home Financials for this Owner
Home Financials are based on the most recent Mortgage that was taken out on this home.
Original Mortgage
$247,474
Outstanding Balance
$220,954
Interest Rate
2.6%
Mortgage Type
New Conventional
Estimated Equity
$139,121
Purchase Details
Closed on
Feb 15, 2007
Sold by
Damascus Hms Llc
Bought by
Walton Jeremy S and Walton Sara M
Home Financials for this Owner
Home Financials are based on the most recent Mortgage that was taken out on this home.
Original Mortgage
$185,323
Interest Rate
6.17%
Mortgage Type
FHA
Purchase Details
Closed on
Jun 11, 2004
Sold by
Eastside Holdings Llc
Bought by
Damascus Homes Llc
Purchase Details
Closed on
Oct 4, 2002
Bought by
Matrix Development Llc
Create a Home Valuation Report for This Property
The Home Valuation Report is an in-depth analysis detailing your home's value as well as a comparison with similar homes in the area
Home Values in the Area
Average Home Value in this Area
Purchase History
| Date | Buyer | Sale Price | Title Company |
|---|---|---|---|
| Attard Steven Robert | $245,000 | -- | |
| Walton Jeremy S | $188,300 | -- | |
| Damascus Homes Llc | $39,500 | -- | |
| Matrix Development Llc | -- | -- |
Source: Public Records
Mortgage History
| Date | Status | Borrower | Loan Amount |
|---|---|---|---|
| Open | Attard Steven Robert | $247,474 | |
| Previous Owner | Walton Jeremy S | $185,323 |
Source: Public Records
Tax History Compared to Growth
Tax History
| Year | Tax Paid | Tax Assessment Tax Assessment Total Assessment is a certain percentage of the fair market value that is determined by local assessors to be the total taxable value of land and additions on the property. | Land | Improvement |
|---|---|---|---|---|
| 2024 | $2,974 | $117,549 | $27,600 | $89,949 |
| 2023 | $2,975 | $117,949 | $27,600 | $90,349 |
| 2022 | $2,784 | $94,860 | $19,600 | $75,260 |
| 2021 | $2,141 | $72,545 | $16,000 | $56,545 |
| 2020 | $2,139 | $72,545 | $16,000 | $56,545 |
| 2019 | $2,174 | $72,545 | $16,000 | $56,545 |
| 2018 | $1,999 | $66,272 | $12,400 | $53,872 |
| 2017 | $1,564 | $53,714 | $12,400 | $41,314 |
| 2016 | $1,532 | $52,095 | $12,400 | $39,695 |
| 2015 | $1,552 | $52,522 | $12,400 | $40,122 |
| 2014 | -- | $48,389 | $7,840 | $40,549 |
| 2013 | -- | $45,790 | $7,840 | $37,950 |
Source: Public Records
Map
Nearby Homes
- 410 Tori Dr
- 532 Hemlock Dr
- 1610 Trey Ln
- 364 Pleasant Hill Church Rd
- 2141 Kirkland Dr
- 364 Pleasant Hill Church Rd SE
- 197 Pleasant Hill Church Rd SE
- 2070 Dooley Town Rd
- 1849 Dooley Town Rd
- The Baxley Plan at Statham Place
- The Landon II Plan at Statham Place
- 29 Nunnally Rd SE
- 1679 Atlanta Hwy SE
- 162 Ashton Ln
- 2075 Georgia Highway 211
- 2075 Highway 211 NE
- 133 2nd St
- 79 Lyles Corner
- 384 Sunset Dr
- 226 Baker St
- 1574 Tyler Ct
- 1572 Tyler Ct
- 1573 Tyler Ct
- 0 Tyler Ct
- 511 Hemlock Dr
- 507 Hemlock Dr
- 505 Hemlock Dr
- 410 Tori Dr Unit 58
- 513 Hemlock Dr
- 414 Tori Dr
- 408 Tori Dr
- 503 Hemlock Dr
- 416 Tori Dr
- 406 Tori Dr
- 529 Hemlock Dr
- 527 Hemlock Dr
- 0 Hemlock Dr Unit 7498846
- 0 Hemlock Dr Unit 7212099
- 0 Hemlock Dr Unit 7069262
- 0 Hemlock Dr Unit 7043252