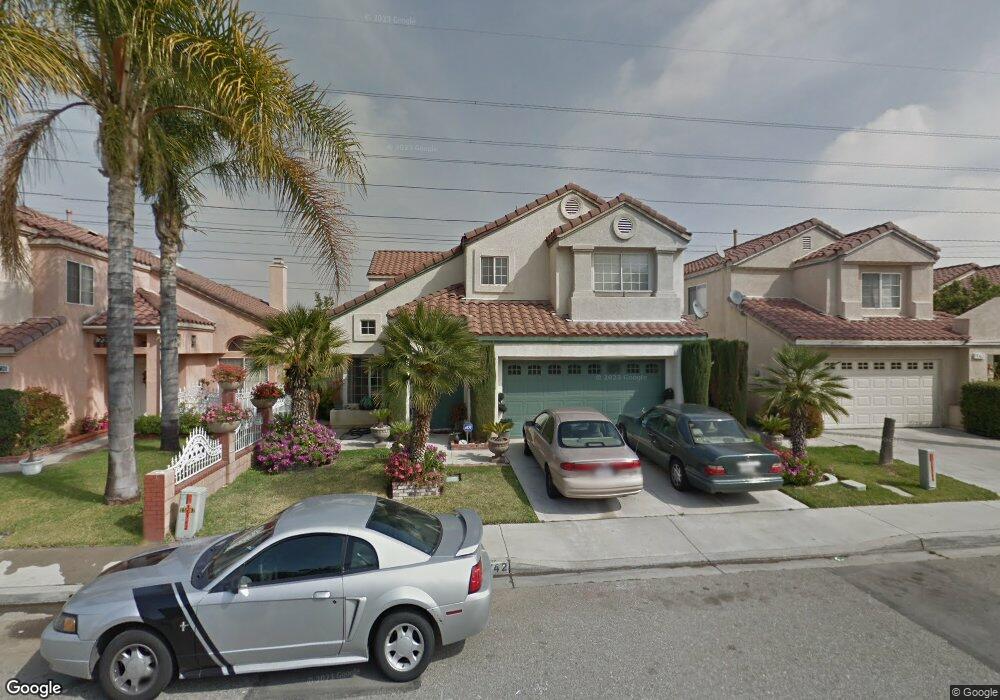
15742 Fiddleleaf Rd Fontana, CA 92337
Southridge Village NeighborhoodEstimated Value: $613,000 - $711,000
4
Beds
3
Baths
2,415
Sq Ft
$274/Sq Ft
Est. Value
About This Home
This home is located at 15742 Fiddleleaf Rd, Fontana, CA 92337 and is currently estimated at $662,453, approximately $274 per square foot. 15742 Fiddleleaf Rd is a home located in San Bernardino County with nearby schools including Jurupa Vista Elementary School, Ruth O. Harris Middle School, and Bloomington High School.
Ownership History
Date
Name
Owned For
Owner Type
Purchase Details
Closed on
Mar 9, 2005
Sold by
Mitchell Rufus A
Bought by
Mitchell Rufus A and Mitchell Cynthia D
Current Estimated Value
Purchase Details
Closed on
Jul 28, 2004
Sold by
Mitchell Cynthia D
Bought by
Mitchell Rufus A
Home Financials for this Owner
Home Financials are based on the most recent Mortgage that was taken out on this home.
Original Mortgage
$204,000
Outstanding Balance
$111,372
Interest Rate
7.55%
Mortgage Type
New Conventional
Estimated Equity
$551,081
Purchase Details
Closed on
Apr 12, 1995
Sold by
Fiesta Homes Inc
Bought by
Mitchell Rufus A and Michell Cynthia D
Home Financials for this Owner
Home Financials are based on the most recent Mortgage that was taken out on this home.
Original Mortgage
$163,189
Interest Rate
7.88%
Mortgage Type
Assumption
Create a Home Valuation Report for This Property
The Home Valuation Report is an in-depth analysis detailing your home's value as well as a comparison with similar homes in the area
Home Values in the Area
Average Home Value in this Area
Purchase History
| Date | Buyer | Sale Price | Title Company |
|---|---|---|---|
| Mitchell Rufus A | -- | None Available | |
| Mitchell Rufus A | -- | Chicago Title Company | |
| Mitchell Rufus A | $160,000 | Orange Coast Title |
Source: Public Records
Mortgage History
| Date | Status | Borrower | Loan Amount |
|---|---|---|---|
| Open | Mitchell Rufus A | $204,000 | |
| Previous Owner | Mitchell Rufus A | $163,189 |
Source: Public Records
Tax History Compared to Growth
Tax History
| Year | Tax Paid | Tax Assessment Tax Assessment Total Assessment is a certain percentage of the fair market value that is determined by local assessors to be the total taxable value of land and additions on the property. | Land | Improvement |
|---|---|---|---|---|
| 2025 | $3,078 | $268,060 | $66,609 | $201,451 |
| 2024 | $3,078 | $262,804 | $65,303 | $197,501 |
| 2023 | $4,966 | $257,651 | $64,023 | $193,628 |
| 2022 | $4,843 | $252,599 | $62,768 | $189,831 |
| 2021 | $4,858 | $247,646 | $61,537 | $186,109 |
| 2020 | $4,816 | $245,107 | $60,906 | $184,201 |
| 2019 | $4,709 | $240,301 | $59,712 | $180,589 |
| 2018 | $4,607 | $235,589 | $58,541 | $177,048 |
| 2017 | $4,448 | $230,969 | $57,393 | $173,576 |
| 2016 | $4,487 | $226,441 | $56,268 | $170,173 |
| 2015 | $4,343 | $223,040 | $55,423 | $167,617 |
| 2014 | $4,220 | $218,671 | $54,337 | $164,334 |
Source: Public Records
Map
Nearby Homes
- 11415 Aberdeen Dr
- 11355 Tondela St
- 15849 Firethorn Rd
- 11544 Sheffield Rd
- 15965 Peach Tree Ln
- 11484 Lime Orchard Ln
- 11337 Concord Cir
- 15793 Willow Dr
- 15313 Coleen St
- 16200 Coleen St
- 11460 Lone Tree Ct
- 12022 Loyola Ct
- Plan 2000 at Parkview - Arbor at Parkview
- Plan 1877 at Parkview - Arbor at Parkview
- Plan 1666 at Parkview - Arbor at Parkview
- 14963 Colby Place
- 10881 Oleander Ave
- Plan 2320 at Parkview - Canopy at Parkview
- Plan 2056 at Parkview - Canopy at Parkview
- Plan 1791 at Parkview - Canopy at Parkview
- 15736 Fiddleleaf Rd
- 15756 Fiddleleaf Rd
- 15730 Fiddleleaf Rd
- 15762 Fiddleleaf Rd
- 15743 Fiddleleaf Rd
- 15722 Fiddleleaf Rd
- 15737 Fiddleleaf Rd
- 15749 Fiddleleaf Rd
- 11425 Leatherleaf Rd
- 15755 Fiddleleaf Rd
- 15770 Fiddleleaf Rd
- 15763 Fiddleleaf Rd
- 15716 Fiddleleaf Rd
- 11438 Privet Ct
- 15778 Fiddleleaf Rd
- 15771 Fiddleleaf Rd
- 11439 Leatherleaf Rd
- 15714 Fiddleleaf Rd
- 11444 Privet Ct
- 11418 Leatherleaf Rd