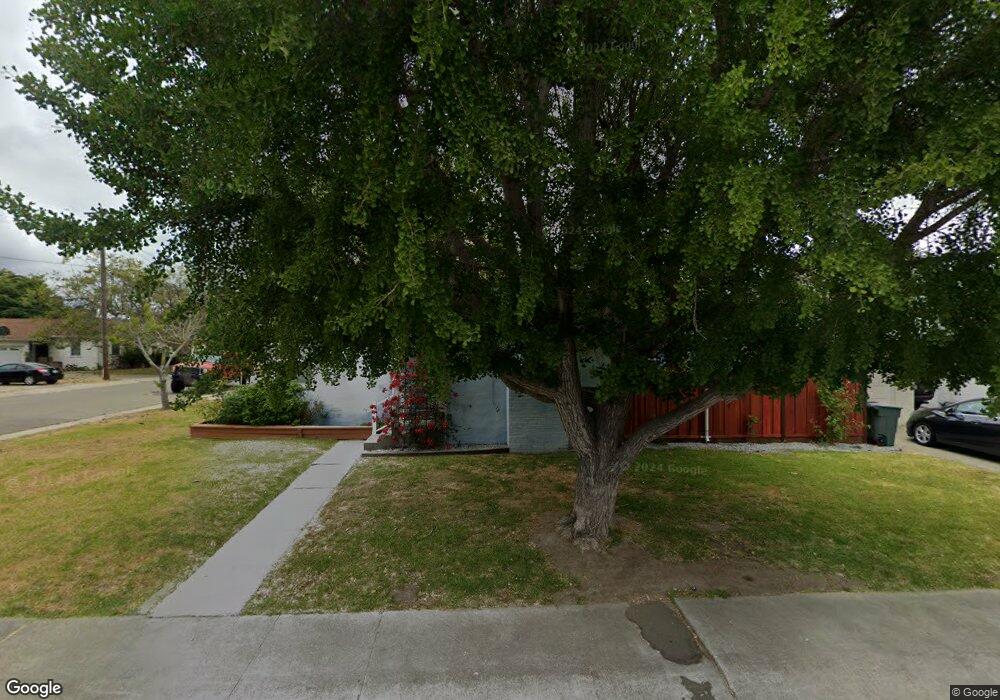
15748 Via Regio San Lorenzo, CA 94580
Estimated Value: $749,869 - $802,000
3
Beds
1
Bath
1,130
Sq Ft
$690/Sq Ft
Est. Value
About This Home
This home is located at 15748 Via Regio, San Lorenzo, CA 94580 and is currently estimated at $779,717, approximately $690 per square foot. 15748 Via Regio is a home located in Alameda County with nearby schools including Grant Elementary School, Washington Manor Middle School, and Arroyo High School.
Ownership History
Date
Name
Owned For
Owner Type
Purchase Details
Closed on
May 13, 2022
Sold by
Kjono Judy Ann Dowell and Kjono Judy Ann
Bought by
Kjono Judy Ann
Current Estimated Value
Home Financials for this Owner
Home Financials are based on the most recent Mortgage that was taken out on this home.
Original Mortgage
$1,155,000
Outstanding Balance
$1,083,188
Interest Rate
4.1%
Mortgage Type
New Conventional
Estimated Equity
-$303,471
Purchase Details
Closed on
Dec 10, 2021
Sold by
Ann Dowell
Bought by
Bobby Joe Dowell And Ann Dowell 1991 Revocabl and Dowel Ann
Purchase Details
Closed on
Dec 6, 2021
Sold by
Kjono Judy Ann Dowell and Kjono Bobby Joe
Bought by
Kjono Judy Ann Dowell
Purchase Details
Closed on
Aug 10, 2010
Sold by
Dowell Ann
Bought by
Dowell Ann and Bobby Joe & Ann Dowell 1991 Re
Create a Home Valuation Report for This Property
The Home Valuation Report is an in-depth analysis detailing your home's value as well as a comparison with similar homes in the area
Home Values in the Area
Average Home Value in this Area
Purchase History
| Date | Buyer | Sale Price | Title Company |
|---|---|---|---|
| Kjono Judy Ann | -- | New Title Company Name | |
| Bobby Joe Dowell And Ann Dowell 1991 Revocabl | -- | -- | |
| Kjono Judy Ann Dowell | -- | None Available | |
| Bobby Joe Dowell And Ann Dowell 1991 Revocabl | -- | -- | |
| Dowell Ann | -- | None Available |
Source: Public Records
Mortgage History
| Date | Status | Borrower | Loan Amount |
|---|---|---|---|
| Open | Kjono Judy Ann | $1,155,000 | |
| Closed | Kjono Judy Ann | $1,155,000 |
Source: Public Records
Tax History Compared to Growth
Tax History
| Year | Tax Paid | Tax Assessment Tax Assessment Total Assessment is a certain percentage of the fair market value that is determined by local assessors to be the total taxable value of land and additions on the property. | Land | Improvement |
|---|---|---|---|---|
| 2025 | $2,926 | $182,874 | $133,019 | $49,855 |
| 2024 | $2,926 | $179,288 | $130,411 | $48,877 |
| 2023 | $2,929 | $175,774 | $127,855 | $47,919 |
| 2022 | $2,871 | $172,329 | $125,349 | $46,980 |
| 2021 | $2,785 | $168,950 | $122,891 | $46,059 |
| 2020 | $2,713 | $167,218 | $121,631 | $45,587 |
| 2019 | $2,701 | $163,940 | $119,247 | $44,693 |
| 2018 | $2,500 | $160,726 | $116,909 | $43,817 |
| 2017 | $2,391 | $157,575 | $114,617 | $42,958 |
| 2016 | $2,278 | $154,485 | $112,370 | $42,115 |
| 2015 | $2,226 | $152,165 | $110,682 | $41,483 |
| 2014 | $2,194 | $149,184 | $108,514 | $40,670 |
Source: Public Records
Map
Nearby Homes
- 638 Paseo Del Rio
- 15867 Hesperian Blvd
- 15881 Paseo Largavista
- 15540 Hesperian Blvd
- 0 E 14th St Unit 41059501
- 15539 Usher St
- 15609 Ronda St
- 16011 Via Conejo
- 747 Lewelling Blvd
- 747 Lewelling Blvd Unit SPC 22
- 840 Woodgate Dr
- 670 Fargo Ave Unit 5
- 874 Lewelling Blvd
- 650 Fargo Ave Unit 4
- 987 Via Bregani
- 16050 Via Olinda
- 720 Fargo Ave Unit 14
- 700 Fargo Ave Unit 2
- 700 Fargo Ave Unit 5
- 700 Fargo Ave Unit 12
- 15717 Via Colusa
- 15375 Via Colusa
- 15752 Via Regio
- 15756 Via Regio
- 15735 Via Colusa
- 15741 Via Colusa
- 15714 Via Colusa
- 15739 Via Regio
- 15743 Via Regio
- 15708 Via Colusa
- 15747 Via Regio
- 15718 Via Colusa
- 15745 Via Colusa
- 15735 Via Regio
- 15760 Via Regio
- 15731 Via Regio
- 15751 Via Regio
- 15749 Via Colusa
- 15722 Via Colusa
- 622 Paseo Del Rio