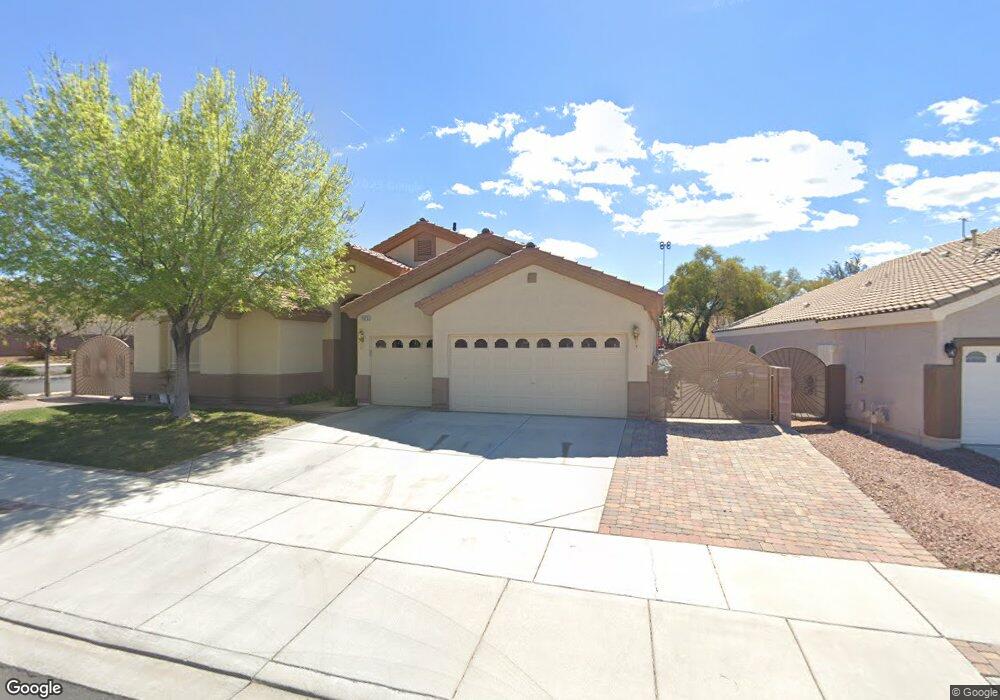
1575 Cattle Ranch Place Henderson, NV 89002
River Mountain NeighborhoodEstimated Value: $629,085 - $665,000
4
Beds
3
Baths
2,550
Sq Ft
$252/Sq Ft
Est. Value
About This Home
This home is located at 1575 Cattle Ranch Place, Henderson, NV 89002 and is currently estimated at $641,771, approximately $251 per square foot. 1575 Cattle Ranch Place is a home located in Clark County with nearby schools including J. Marlan Walker International School, Jack & Terry Mannion Middle School, and Basic Academy of International Studies.
Ownership History
Date
Name
Owned For
Owner Type
Purchase Details
Closed on
May 27, 2020
Sold by
Raymond David N
Bought by
Raymond David Nelson and David Nelson Raymond Trust
Current Estimated Value
Purchase Details
Closed on
Mar 8, 2013
Sold by
Giunta Diane
Bought by
Raymond David N
Purchase Details
Closed on
Oct 25, 2004
Sold by
D R Horton Inc
Bought by
Old Vegas Manor & Estates Homeowners Ass
Purchase Details
Closed on
Sep 22, 2003
Sold by
D R Horton Inc
Bought by
Raymond David N and Giunta Diane
Home Financials for this Owner
Home Financials are based on the most recent Mortgage that was taken out on this home.
Original Mortgage
$235,200
Interest Rate
6.17%
Mortgage Type
Unknown
Purchase Details
Closed on
Dec 19, 2001
Sold by
Rio Properties Inc
Bought by
D R Horton Inc
Create a Home Valuation Report for This Property
The Home Valuation Report is an in-depth analysis detailing your home's value as well as a comparison with similar homes in the area
Home Values in the Area
Average Home Value in this Area
Purchase History
| Date | Buyer | Sale Price | Title Company |
|---|---|---|---|
| Raymond David Nelson | -- | None Available | |
| Raymond David N | -- | None Available | |
| Old Vegas Manor & Estates Homeowners Ass | -- | Chicago Title | |
| Old Vegas Ranch Landscape Maintenance As | -- | Chicago Title | |
| Raymond David N | $294,610 | United Title Of Nevada | |
| D R Horton Inc | $11,500,000 | United Title |
Source: Public Records
Mortgage History
| Date | Status | Borrower | Loan Amount |
|---|---|---|---|
| Previous Owner | Raymond David N | $235,200 |
Source: Public Records
Tax History Compared to Growth
Tax History
| Year | Tax Paid | Tax Assessment Tax Assessment Total Assessment is a certain percentage of the fair market value that is determined by local assessors to be the total taxable value of land and additions on the property. | Land | Improvement |
|---|---|---|---|---|
| 2025 | $2,852 | $162,603 | $36,750 | $125,853 |
| 2024 | $2,769 | $162,603 | $36,750 | $125,853 |
| 2023 | $2,769 | $162,692 | $44,450 | $118,242 |
| 2022 | $2,689 | $146,308 | $38,150 | $108,158 |
| 2021 | $2,611 | $135,342 | $32,550 | $102,792 |
| 2020 | $2,532 | $134,340 | $32,550 | $101,790 |
| 2019 | $2,458 | $128,668 | $28,700 | $99,968 |
| 2018 | $2,386 | $123,045 | $26,600 | $96,445 |
| 2017 | $3,546 | $122,328 | $24,500 | $97,828 |
| 2016 | $2,260 | $95,589 | $14,700 | $80,889 |
| 2015 | $2,255 | $83,415 | $14,700 | $68,715 |
| 2014 | $2,185 | $73,186 | $10,500 | $62,686 |
Source: Public Records
Map
Nearby Homes
- 2413 Gold Camp St
- 2412 Bounty Hunter Ct
- 1549 Broken Bell Ln
- 1596 Rusty Ridge Ln
- 2357 Mundare Dr
- 1554 Ward Frontier Ln
- 1557 Ward Frontier Ln
- 1582 Wild Willey Way
- 2509 April Breeze Ln
- 1629 Lone Palm Ct
- 2560 Alias Smith Dr
- 2566 Velez Valley Way
- 2269 Sky Island Dr
- 2567 Land Rush Dr
- 1076 Country Coach Dr
- 2193 Red Alder St
- 1511 Rawhide Dr
- 1085 Pleasure Ln Unit 3
- 2181 Maple Shade St
- 1088 Paradise Coach Dr
- 1571 Cattle Ranch Place
- 1567 Cattle Ranch Place
- 2415 Sharp Spur Dr
- 1583 Cattle Ranch Place
- 2414 Cook Out Ct
- 2444 Belt Buckley Dr
- 2446 Belt Buckley Dr Unit 2
- 2420 Sharp Spur Dr
- 2448 Belt Buckley Dr
- 2442 Belt Buckley Dr
- 1587 Cattle Ranch Place
- 2411 Sharp Spur Dr
- 2450 Belt Buckley Dr
- 2440 Belt Buckley Dr
- 2440 Belt Buckley Dr Unit n/a
- 2416 Sharp Spur Dr
- 2410 Cook Out Ct
- 2452 Belt Buckley Dr
- 1559 Cattle Ranch Place
- 2438 Belt Buckley Dr