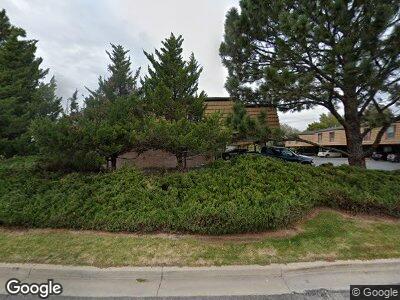
1575 Tyler Ave Unit 2 Ogden, UT 84404
Canyon Road NeighborhoodEstimated Value: $279,000 - $297,000
3
Beds
2
Baths
1,625
Sq Ft
$177/Sq Ft
Est. Value
About This Home
This home is located at 1575 Tyler Ave Unit 2, Ogden, UT 84404 and is currently estimated at $287,937, approximately $177 per square foot. 1575 Tyler Ave Unit 2 is a home located in Weber County with nearby schools including Mound Fort Junior High School and Ben Lomond High School.
Ownership History
Date
Name
Owned For
Owner Type
Purchase Details
Closed on
May 20, 2020
Sold by
Morris Barbara and Morris David
Bought by
Stump April
Current Estimated Value
Home Financials for this Owner
Home Financials are based on the most recent Mortgage that was taken out on this home.
Original Mortgage
$140,000
Outstanding Balance
$125,676
Interest Rate
3.3%
Mortgage Type
New Conventional
Estimated Equity
$160,600
Purchase Details
Closed on
Sep 14, 2017
Sold by
Bosgieter Justin
Bought by
Morris Barbara and Morris David
Purchase Details
Closed on
May 10, 2017
Sold by
Plowman Brady J
Bought by
Bosgieter Justin and Bosgieter Kellie
Purchase Details
Closed on
Jun 29, 2012
Sold by
Stuart Sandra H
Bought by
Plowman Brady J and Plowman Nicole M
Home Financials for this Owner
Home Financials are based on the most recent Mortgage that was taken out on this home.
Original Mortgage
$64,000
Interest Rate
3.74%
Mortgage Type
New Conventional
Create a Home Valuation Report for This Property
The Home Valuation Report is an in-depth analysis detailing your home's value as well as a comparison with similar homes in the area
Home Values in the Area
Average Home Value in this Area
Purchase History
| Date | Buyer | Sale Price | Title Company |
|---|---|---|---|
| Stump April | -- | Us Title Insurance Agency | |
| Morris Barbara | -- | Stewart Title Ins Agency Of | |
| Bosgieter Justin | -- | Mountain View Title | |
| Plowman Brady J | -- | Eagle Gate Title Insurnace A |
Source: Public Records
Mortgage History
| Date | Status | Borrower | Loan Amount |
|---|---|---|---|
| Open | Stump April | $140,000 | |
| Previous Owner | Plowman Brady J | $64,000 | |
| Previous Owner | Stuart W Mack | $60,000 |
Source: Public Records
Tax History Compared to Growth
Tax History
| Year | Tax Paid | Tax Assessment Tax Assessment Total Assessment is a certain percentage of the fair market value that is determined by local assessors to be the total taxable value of land and additions on the property. | Land | Improvement |
|---|---|---|---|---|
| 2024 | $1,834 | $145,200 | $33,000 | $112,200 |
| 2023 | $1,857 | $147,950 | $33,000 | $114,950 |
| 2022 | $1,838 | $146,850 | $33,000 | $113,850 |
| 2021 | $1,538 | $204,000 | $35,000 | $169,000 |
| 2020 | $1,192 | $146,000 | $22,000 | $124,000 |
| 2019 | $1,217 | $140,000 | $18,000 | $122,000 |
| 2018 | $1,199 | $137,000 | $18,000 | $119,000 |
| 2017 | $937 | $100,000 | $13,000 | $87,000 |
| 2016 | $801 | $46,200 | $7,150 | $39,050 |
| 2015 | $723 | $40,700 | $7,150 | $33,550 |
| 2014 | $726 | $40,150 | $7,150 | $33,000 |
Source: Public Records
Map
Nearby Homes
- 2130 S Harrison Blvd
- 1286 1640 S
- 1304 Millcreek Dr Unit 5
- 1333 Lorl Ln Unit 6
- 1298 Lorl Ln Unit 2
- 1384 Millcreek Dr Unit 6
- 1357 Lorl Ln Unit 2
- 1300 Lorl Ln Unit 5
- 1522 Robins Cir
- 1175 Canyon Rd Unit 85
- 1175 Canyon Rd Unit 72
- 1489 Brinker Ave Unit D4
- 1164 E 1390 S
- 1427 Blossom Ln
- 1076 Creekside Dr
- 1053 Sara Ln
- 1031 Sara Ln
- 1077 1280 S
- 1451 Olympic Ln
- 1144 E 1200 St S
- 1575 Tyler Ave Unit 1
- 1575 Tyler Ave Unit 2
- 1575 Tyler Ave Unit 3
- 1575 Tyler Ave Unit 4
- 1575 Tyler Ave Unit 5
- 1575 Tyler Ave Unit 6
- 1575 Tyler Ave
- 1555 Tyler Ave Unit 6
- 1555 Tyler Ave Unit 5
- 1555 Tyler Ave Unit 4
- 1555 Tyler Ave Unit 3
- 1555 Tyler Ave Unit 2
- 1555 Tyler Ave Unit 1
- 1555 Tyler Ave
- 1555 Tyler Ave Unit 127
- 3453 S Harrison Blvd
- 1578 Tyler Ave
- 1295 Lorl Ln Unit 1
- 1295 Lorl Ln Unit 2
- 1295 Lorl Ln Unit 3