15755 Via Calanova San Diego, CA 92128
Rancho Bernardo NeighborhoodEstimated Value: $724,380 - $795,000
2
Beds
2
Baths
1,185
Sq Ft
$652/Sq Ft
Est. Value
About This Home
This home is located at 15755 Via Calanova, San Diego, CA 92128 and is currently estimated at $772,345, approximately $651 per square foot. 15755 Via Calanova is a home located in San Diego County with nearby schools including Highland Ranch Elementary School, Bernardo Heights Middle, and Rancho Bernardo High.
Ownership History
Date
Name
Owned For
Owner Type
Purchase Details
Closed on
Apr 27, 2016
Sold by
Clemons Marna L
Bought by
Williams Margaret B
Current Estimated Value
Purchase Details
Closed on
Feb 7, 2012
Sold by
Stuebing Joyce E and Clemons Marna L
Bought by
Stuebing Joyce E and Clemons Marna L
Purchase Details
Closed on
Nov 11, 1999
Sold by
Stuebing Robert O and Stuebing Joyce E
Bought by
Stuebing Robert O and Stuebing Joyce E
Purchase Details
Closed on
Oct 27, 1997
Sold by
Pachek Leo A and Pachek Judith A
Bought by
Stuebing Robert O and Stuebing Joyce E
Home Financials for this Owner
Home Financials are based on the most recent Mortgage that was taken out on this home.
Original Mortgage
$75,000
Interest Rate
6.77%
Mortgage Type
Purchase Money Mortgage
Purchase Details
Closed on
Mar 25, 1996
Sold by
Klokke F Irene
Bought by
Pachek Leo A and Pachek Judith A
Home Financials for this Owner
Home Financials are based on the most recent Mortgage that was taken out on this home.
Original Mortgage
$141,500
Interest Rate
7.41%
Mortgage Type
Purchase Money Mortgage
Purchase Details
Closed on
Dec 4, 1986
Create a Home Valuation Report for This Property
The Home Valuation Report is an in-depth analysis detailing your home's value as well as a comparison with similar homes in the area
Home Values in the Area
Average Home Value in this Area
Purchase History
| Date | Buyer | Sale Price | Title Company |
|---|---|---|---|
| Williams Margaret B | $420,000 | First American Title Company | |
| Stuebing Joyce E | -- | None Available | |
| Stuebing Robert O | -- | -- | |
| Stuebing Robert O | $151,000 | Fidelity National Title | |
| Pachek Leo A | $149,000 | Chicago Title Co | |
| -- | $127,000 | -- |
Source: Public Records
Mortgage History
| Date | Status | Borrower | Loan Amount |
|---|---|---|---|
| Previous Owner | Stuebing Robert O | $75,000 | |
| Previous Owner | Pachek Leo A | $141,500 |
Source: Public Records
Tax History Compared to Growth
Tax History
| Year | Tax Paid | Tax Assessment Tax Assessment Total Assessment is a certain percentage of the fair market value that is determined by local assessors to be the total taxable value of land and additions on the property. | Land | Improvement |
|---|---|---|---|---|
| 2025 | $1,705 | $158,784 | $38,558 | $120,226 |
| 2024 | $1,705 | $155,671 | $37,802 | $117,869 |
| 2023 | $1,667 | $152,619 | $37,061 | $115,558 |
| 2022 | $1,638 | $149,628 | $36,335 | $113,293 |
| 2021 | $1,615 | $146,695 | $35,623 | $111,072 |
| 2020 | $1,593 | $145,192 | $35,258 | $109,934 |
| 2019 | $1,551 | $142,346 | $34,567 | $107,779 |
| 2018 | $1,506 | $139,556 | $33,890 | $105,666 |
| 2017 | $1,464 | $136,821 | $33,226 | $103,595 |
| 2016 | $2,278 | $203,659 | $67,434 | $136,225 |
| 2015 | $2,244 | $200,601 | $66,422 | $134,179 |
| 2014 | $2,115 | $196,672 | $65,121 | $131,551 |
Source: Public Records
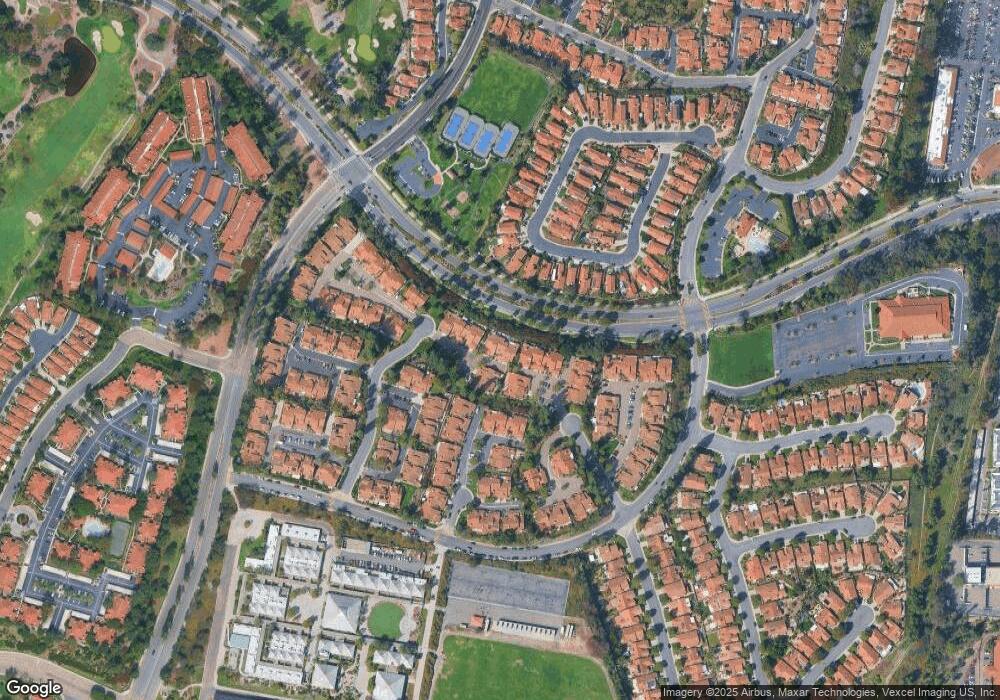
Map
Nearby Homes
- 15662 Via Calanova
- 15617 Caldas de Reyes
- 15662 Caminito la Torre
- 15818 Caminito Aire Puro
- 12290 Corte Sabio Unit 3101
- 12623 Calle Charmona
- 12532 Paseo Lucido Unit 144
- 15945 Avenida Villaha Unit 32
- 12152 Royal Birkdale Row Unit B
- 12122 Royal Birkdale Row Unit 403
- 12132 Royal Birkdale Row Unit 303 E
- 12132 Royal Birkdale Row
- 15389 Avenida Rorras
- 16182 Selva Dr
- 12105 View Pointe Row
- 16021 Pomerado Rd
- 12131 View Pointe Row
- 12206 Fairway Pointe Row
- 12257 Avenida Consentido
- 12486 Lomica Dr
- 15767 Via Calanova Unit LU89
- 15757 Via Calanova
- 15743 Via Calanova
- 15745 Via Calanova Unit LU83
- 15763 Via Calanova
- 15753 Via Calanova
- 15765 Via Calanova
- 12521 Caminito Rosita
- 12529 Caminito Rosita
- 12513 Caminito Rosita
- 12537 Caminito Rosita Unit 25
- 12545 Caminito Rosita
- 15643 Via Calanova
- 15677 Via Calanova
- 15675 Via Calanova Unit LU78
- 15673 Via Calanova
- 15645 Via Calanova
- 15665 Via Calanova
- 15663 Via Calanova
- 15655 Via Calanova