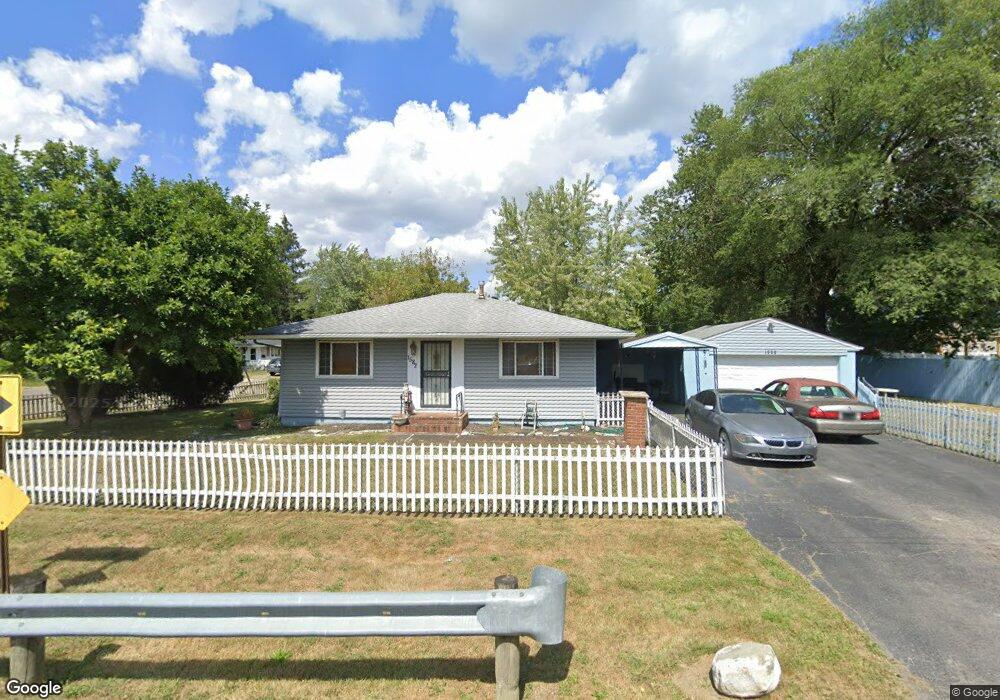
1576 Koebel Rd Columbus, OH 43207
Marion Franklin NeighborhoodEstimated Value: $155,932 - $191,000
3
Beds
1
Bath
896
Sq Ft
$185/Sq Ft
Est. Value
About This Home
This home is located at 1576 Koebel Rd, Columbus, OH 43207 and is currently estimated at $165,983, approximately $185 per square foot. 1576 Koebel Rd is a home located in Franklin County with nearby schools including Watkins Elementary School, Buckeye Middle School, and Marion-Franklin High School.
Ownership History
Date
Name
Owned For
Owner Type
Purchase Details
Closed on
Apr 2, 2007
Sold by
Accredited Home Lenders Inc
Bought by
Wehinger Iv Ltd
Current Estimated Value
Purchase Details
Closed on
Feb 5, 2007
Sold by
Bates Angela E and Case #05Cve05 7037
Bought by
Accredited Home Lenders Inc
Purchase Details
Closed on
Aug 26, 2005
Sold by
All Star Lp
Bought by
Bates Angela
Home Financials for this Owner
Home Financials are based on the most recent Mortgage that was taken out on this home.
Original Mortgage
$58,000
Interest Rate
9.37%
Mortgage Type
Fannie Mae Freddie Mac
Purchase Details
Closed on
Apr 26, 2005
Sold by
Columbus Metropolitan Housing Authority
Bought by
All Star Lp
Purchase Details
Closed on
Sep 12, 1968
Bought by
Columbus Metropolitan
Create a Home Valuation Report for This Property
The Home Valuation Report is an in-depth analysis detailing your home's value as well as a comparison with similar homes in the area
Home Values in the Area
Average Home Value in this Area
Purchase History
| Date | Buyer | Sale Price | Title Company |
|---|---|---|---|
| Wehinger Iv Ltd | $48,000 | Land Caste | |
| Accredited Home Lenders Inc | $36,000 | Land Castle | |
| Bates Angela | $72,500 | Chelsea Tit | |
| All Star Lp | -- | Preferred T | |
| Columbus Metropolitan | -- | -- |
Source: Public Records
Mortgage History
| Date | Status | Borrower | Loan Amount |
|---|---|---|---|
| Previous Owner | Bates Angela | $58,000 |
Source: Public Records
Tax History Compared to Growth
Tax History
| Year | Tax Paid | Tax Assessment Tax Assessment Total Assessment is a certain percentage of the fair market value that is determined by local assessors to be the total taxable value of land and additions on the property. | Land | Improvement |
|---|---|---|---|---|
| 2024 | $2,146 | $46,830 | $14,700 | $32,130 |
| 2023 | $2,119 | $46,830 | $14,700 | $32,130 |
| 2022 | $1,759 | $22,050 | $8,330 | $13,720 |
| 2021 | $1,174 | $22,050 | $8,330 | $13,720 |
| 2020 | $1,176 | $22,050 | $8,330 | $13,720 |
| 2019 | $1,182 | $19,010 | $7,250 | $11,760 |
| 2018 | $1,139 | $19,010 | $7,250 | $11,760 |
| 2017 | $1,182 | $19,010 | $7,250 | $11,760 |
| 2016 | $1,206 | $17,750 | $2,800 | $14,950 |
| 2015 | $1,098 | $17,750 | $2,800 | $14,950 |
| 2014 | $1,101 | $17,750 | $2,800 | $14,950 |
| 2013 | $571 | $18,655 | $2,940 | $15,715 |
Source: Public Records
Map
Nearby Homes
- 2685 Bulen Ave
- 2626 Diane Place
- 2496 Navarre Rd
- 1299 Yolanda Dr
- 2512 Kitchner Dr
- 1204 Koebel Rd
- 3060 Durham Dr
- 3072 Bluefield Dr
- 3018 Nuway Rd
- 1382 Southfield Dr S
- 3172 Weirton Dr
- 1283 E Innis Ave
- 868 Koebel Ave
- 868 Lawndale Ave
- 1564 Smith Rd Unit 566
- 0 Koebel Rd
- 3369 Norwalk Rd
- 1871 Holburn Ave Unit 873
- 1833 Berkeley Rd
- 990 Reeb Ave