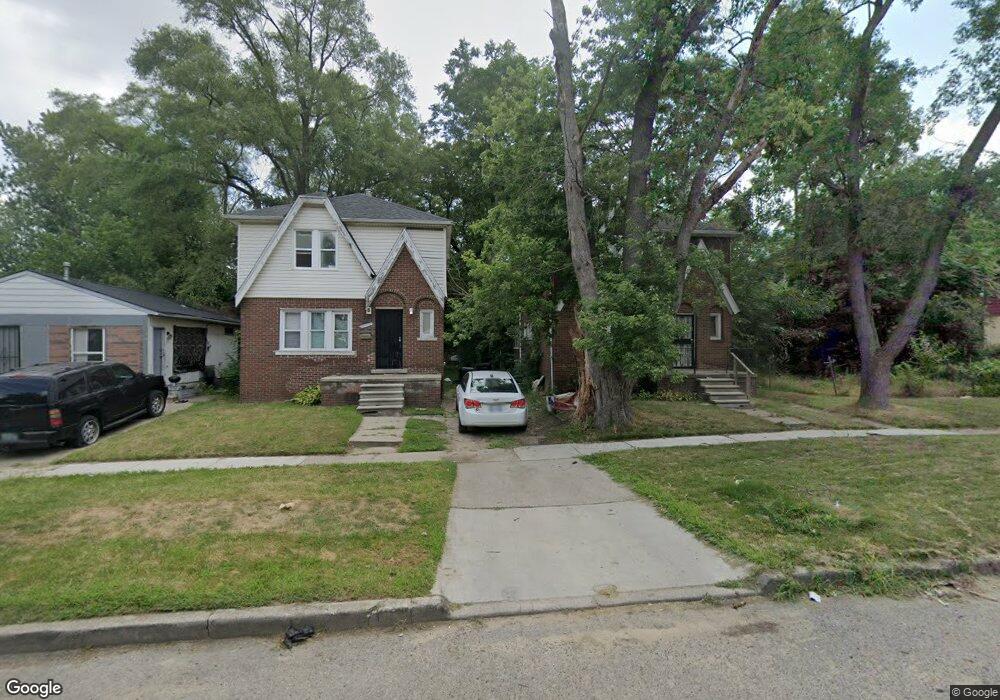
15762 Mark Twain St Unit Bldg-Unit Detroit, MI 48227
Belmont NeighborhoodEstimated Value: $75,455 - $129,000
--
Bed
1
Bath
1,430
Sq Ft
$71/Sq Ft
Est. Value
About This Home
This home is located at 15762 Mark Twain St Unit Bldg-Unit, Detroit, MI 48227 and is currently estimated at $102,114, approximately $71 per square foot. 15762 Mark Twain St Unit Bldg-Unit is a home located in Wayne County with nearby schools including Young Coleman A. Elementary School, John R. King Academic And Performing Arts Academy, and Charles L. Spain Elementary-Middle School.
Ownership History
Date
Name
Owned For
Owner Type
Purchase Details
Closed on
May 13, 2024
Sold by
Johnson Thomas
Bought by
Little Lope Management Llc
Current Estimated Value
Purchase Details
Closed on
Apr 15, 2020
Sold by
Taylor James and Detroit House 1 Llc
Bought by
Johnson Thomas
Purchase Details
Closed on
Dec 28, 2017
Sold by
Secretary Of Housing And Urban Developme
Bought by
Detroit House 1 Llc
Purchase Details
Closed on
Nov 2, 2017
Sold by
Bank Of America N A
Bought by
Secretary Of Housing And Urban Developme
Purchase Details
Closed on
Jan 27, 2010
Sold by
Ambrose Joel P
Bought by
Bac Home Loans Servicing L P
Purchase Details
Closed on
Aug 26, 2003
Sold by
City Of Detroit
Bought by
Ambrose Joel P
Create a Home Valuation Report for This Property
The Home Valuation Report is an in-depth analysis detailing your home's value as well as a comparison with similar homes in the area
Home Values in the Area
Average Home Value in this Area
Purchase History
| Date | Buyer | Sale Price | Title Company |
|---|---|---|---|
| Little Lope Management Llc | $40,000 | None Listed On Document | |
| Little Lope Management Llc | $40,000 | None Listed On Document | |
| Johnson Thomas | $15,000 | None Available | |
| Detroit House 1 Llc | $7,760 | None Available | |
| Secretary Of Housing And Urban Developme | -- | None Available | |
| Bac Home Loans Servicing L P | $86,301 | None Available | |
| Ambrose Joel P | -- | -- |
Source: Public Records
Tax History Compared to Growth
Tax History
| Year | Tax Paid | Tax Assessment Tax Assessment Total Assessment is a certain percentage of the fair market value that is determined by local assessors to be the total taxable value of land and additions on the property. | Land | Improvement |
|---|---|---|---|---|
| 2025 | $908 | $31,500 | $0 | $0 |
| 2024 | $908 | $27,200 | $0 | $0 |
| 2023 | $1,126 | $21,800 | $0 | $0 |
| 2022 | $1,190 | $16,700 | $0 | $0 |
| 2021 | $1,162 | $13,900 | $0 | $0 |
| 2020 | $1,162 | $13,700 | $0 | $0 |
| 2019 | $1,146 | $10,600 | $0 | $0 |
| 2018 | $1,025 | $8,900 | $0 | $0 |
| 2017 | $169 | $8,900 | $0 | $0 |
| 2016 | $1,328 | $13,000 | $0 | $0 |
| 2015 | $1,300 | $13,000 | $0 | $0 |
| 2013 | $1,822 | $18,216 | $0 | $0 |
| 2010 | -- | $26,100 | $690 | $25,410 |
Source: Public Records
Map
Nearby Homes
- 15757 Mark Twain St
- 15786 Ardmore St
- 15703 Ardmore St
- 15748 Hubbell St
- 15767 Cruse St
- 15766 Cruse St
- 15475 Ardmore St
- 16134 Mark Twain St
- 16140 Mark Twain St
- 15400 Mark Twain St
- 15909 Hubbell St
- 15780 Stansbury St
- 15455 Hubbell St
- 15431 Cruse St
- 16171 Mark Twain St
- 15452 Marlowe St
- 15375 Freeland St
- 15720 Lauder St
- 15432 Marlowe St
- 15461 Marlowe St
- 15762 Mark Twain St
- 15756 Mark Twain St
- 15766 Mark Twain St
- 15777 Freeland St
- 15752 Mark Twain St
- 15772 Mark Twain St
- 15748 Mark Twain St
- 15776 Mark Twain St
- 15771 Freeland St
- 15767 Freeland St
- 15763 Freeland St
- 15783 Freeland St
- 15742 Mark Twain St
- 15757 Freeland St
- 15787 Freeland St
- 15738 Mark Twain St
- 15753 Freeland St
- 15767 Mark Twain St Unit Bldg-Unit
- 15767 Mark Twain St
- 15771 Mark Twain St