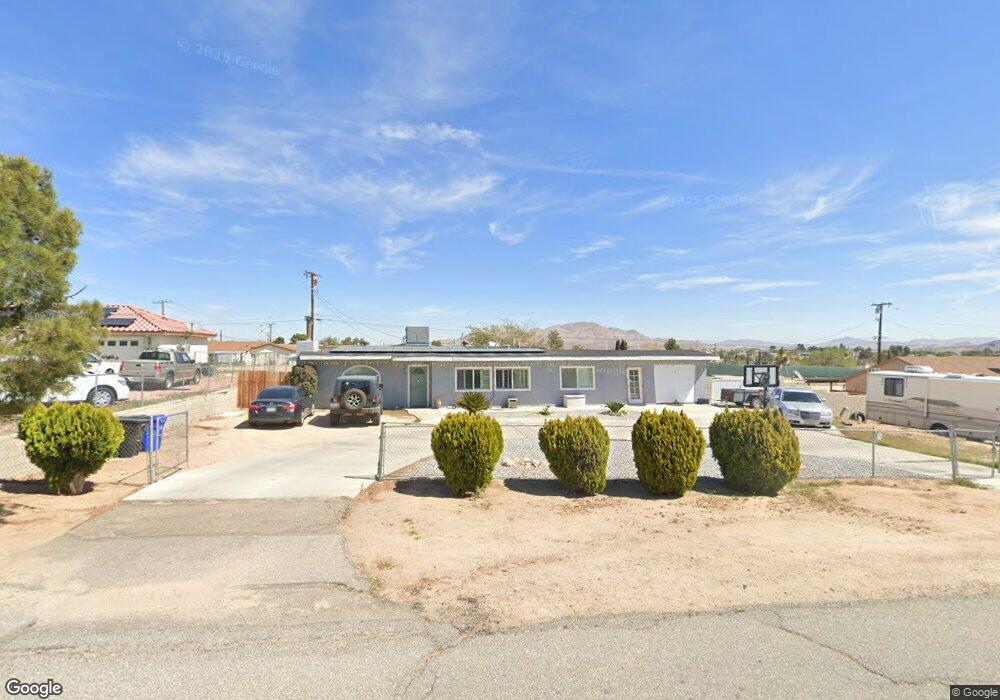
15764 Arbolada Ln Victorville, CA 92394
Estimated Value: $287,000 - $395,772
3
Beds
2
Baths
1,540
Sq Ft
$225/Sq Ft
Est. Value
About This Home
This home is located at 15764 Arbolada Ln, Victorville, CA 92394 and is currently estimated at $345,943, approximately $224 per square foot. 15764 Arbolada Ln is a home located in San Bernardino County with nearby schools including Puesta Del Sol Elementary School, Village Elementary School, and Challenger School Of Sports And Fitness.
Ownership History
Date
Name
Owned For
Owner Type
Purchase Details
Closed on
Nov 11, 2010
Sold by
Bracelly Robby R and Bracelly Brenda L
Bought by
Barraza Steven and Barraza Beatriz
Current Estimated Value
Purchase Details
Closed on
Dec 15, 2005
Sold by
Bracelly Robby R
Bought by
Bracelly Robby R and Bracelly Brenda L
Home Financials for this Owner
Home Financials are based on the most recent Mortgage that was taken out on this home.
Original Mortgage
$154,000
Interest Rate
6.31%
Mortgage Type
New Conventional
Purchase Details
Closed on
May 13, 1996
Sold by
Cetinske John R and Demarse Barbara
Bought by
Bracelly Robby
Home Financials for this Owner
Home Financials are based on the most recent Mortgage that was taken out on this home.
Original Mortgage
$61,200
Interest Rate
8.01%
Mortgage Type
VA
Create a Home Valuation Report for This Property
The Home Valuation Report is an in-depth analysis detailing your home's value as well as a comparison with similar homes in the area
Home Values in the Area
Average Home Value in this Area
Purchase History
| Date | Buyer | Sale Price | Title Company |
|---|---|---|---|
| Barraza Steven | $47,500 | Priority Title | |
| Bracelly Robby R | -- | Financial Title Co | |
| Bracelly Robby | $60,000 | First American Title Ins Co |
Source: Public Records
Mortgage History
| Date | Status | Borrower | Loan Amount |
|---|---|---|---|
| Previous Owner | Bracelly Robby R | $154,000 | |
| Previous Owner | Bracelly Robby | $61,200 |
Source: Public Records
Tax History Compared to Growth
Tax History
| Year | Tax Paid | Tax Assessment Tax Assessment Total Assessment is a certain percentage of the fair market value that is determined by local assessors to be the total taxable value of land and additions on the property. | Land | Improvement |
|---|---|---|---|---|
| 2025 | $828 | $75,593 | $15,377 | $60,216 |
| 2024 | $828 | $74,110 | $15,075 | $59,035 |
| 2023 | $816 | $72,656 | $14,779 | $57,877 |
| 2022 | $799 | $71,231 | $14,489 | $56,742 |
| 2021 | $783 | $69,834 | $14,205 | $55,629 |
| 2020 | $767 | $69,118 | $14,059 | $55,059 |
| 2019 | $753 | $67,762 | $13,783 | $53,979 |
| 2018 | $800 | $66,434 | $13,513 | $52,921 |
| 2017 | $782 | $65,131 | $13,248 | $51,883 |
| 2016 | $765 | $63,854 | $12,988 | $50,866 |
| 2015 | $737 | $62,895 | $12,793 | $50,102 |
| 2014 | $721 | $61,663 | $12,542 | $49,121 |
Source: Public Records
Map
Nearby Homes
- 15802 Malpais Ln
- 15801 Malpais Ln
- 0 Sueno Ln Unit HD25230918
- 16079 Tawney Ridge Ln
- 0 Barranca Way Unit PW25106825
- 0 Barranca Way Unit PW25106858
- 15638 Burwood Rd
- 16098 Tawney Ridge Ln
- 15967 N Culver Rd
- 15413 Burwood Rd
- 15975 Village Dr
- 15337 Don Roberto Rd
- 15770 Mojave Dr
- 15720 Mojave Dr
- 15637 Topango Rd
- 15754 Tern Rd
- 16134 Colina St
- 16000 Burwood Rd
- 15728 La Paz Dr
- 15596 Del Rey Dr
- 15786 Arbolada Ln
- 15744 Arbolada Ln
- 15763 Tawney Ridge Ln
- 15745 Tawney Ridge Ln
- 15781 Tawney Ridge Ln
- 15763 Arbolada Ln
- 15800 Arbolada Ln
- 15745 Arbolada Ln
- 15785 Arbolada Ln
- 15801 Tawney Ridge Ln
- 15654 Condor Rd
- 15670 Condor Rd
- 15766 Malpais Ln
- 15640 Condor Rd
- 15810 Arbolada Ln
- 15746 Malpais Ln
- 15684 Condor Rd
- 15786 Malpais Ln
- 15815 Tawney Ridge Ln
- 15760 Tawney Ridge Ln