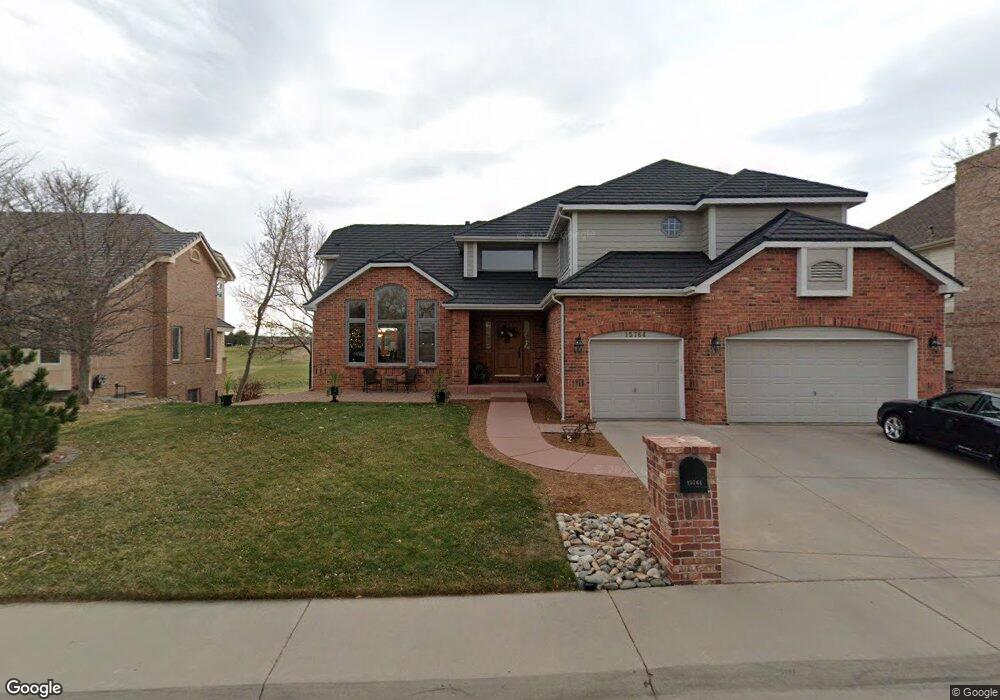
15764 W 67th Place Arvada, CO 80007
Meadows at Westwoods NeighborhoodEstimated Value: $1,057,339 - $1,283,000
4
Beds
7
Baths
3,561
Sq Ft
$331/Sq Ft
Est. Value
About This Home
This home is located at 15764 W 67th Place, Arvada, CO 80007 and is currently estimated at $1,178,085, approximately $330 per square foot. 15764 W 67th Place is a home located in Jefferson County with nearby schools including West Woods Elementary School, Drake Junior High School, and Ralston Valley Senior High School.
Ownership History
Date
Name
Owned For
Owner Type
Purchase Details
Closed on
Sep 30, 2005
Sold by
Vanneste Elizabeth S and Vanneste Laurent G
Bought by
Jensen Julie and Makarov Konstantin
Current Estimated Value
Home Financials for this Owner
Home Financials are based on the most recent Mortgage that was taken out on this home.
Original Mortgage
$552,000
Outstanding Balance
$294,897
Interest Rate
5.73%
Mortgage Type
Fannie Mae Freddie Mac
Estimated Equity
$883,188
Purchase Details
Closed on
Aug 23, 1999
Sold by
Jasen Beste E and Jasen Susan M
Bought by
Vanneste Elizabeth S and Vanneste Laurent G
Home Financials for this Owner
Home Financials are based on the most recent Mortgage that was taken out on this home.
Original Mortgage
$350,000
Interest Rate
6.75%
Purchase Details
Closed on
Sep 30, 1994
Sold by
Bainbridge Inc
Bought by
Beste E Jasen and Beste Susan M
Home Financials for this Owner
Home Financials are based on the most recent Mortgage that was taken out on this home.
Original Mortgage
$328,000
Interest Rate
4.1%
Create a Home Valuation Report for This Property
The Home Valuation Report is an in-depth analysis detailing your home's value as well as a comparison with similar homes in the area
Home Values in the Area
Average Home Value in this Area
Purchase History
| Date | Buyer | Sale Price | Title Company |
|---|---|---|---|
| Jensen Julie | $690,000 | Land Title Guarantee Company | |
| Vanneste Elizabeth S | $525,000 | -- | |
| Beste E Jasen | $410,000 | Land Title |
Source: Public Records
Mortgage History
| Date | Status | Borrower | Loan Amount |
|---|---|---|---|
| Open | Jensen Julie | $552,000 | |
| Previous Owner | Vanneste Elizabeth S | $350,000 | |
| Previous Owner | Beste E Jasen | $328,000 |
Source: Public Records
Tax History Compared to Growth
Tax History
| Year | Tax Paid | Tax Assessment Tax Assessment Total Assessment is a certain percentage of the fair market value that is determined by local assessors to be the total taxable value of land and additions on the property. | Land | Improvement |
|---|---|---|---|---|
| 2024 | $5,795 | $59,742 | $11,417 | $48,325 |
| 2023 | $5,795 | $59,742 | $11,417 | $48,325 |
| 2022 | $4,979 | $50,838 | $15,348 | $35,490 |
| 2021 | $5,061 | $52,300 | $15,789 | $36,511 |
| 2020 | $5,013 | $51,946 | $17,892 | $34,054 |
| 2019 | $4,945 | $51,946 | $17,892 | $34,054 |
| 2018 | $4,551 | $46,481 | $11,633 | $34,848 |
| 2017 | $4,166 | $46,481 | $11,633 | $34,848 |
| 2016 | $4,817 | $50,626 | $12,816 | $37,810 |
| 2015 | $4,408 | $50,626 | $12,816 | $37,810 |
| 2014 | $4,408 | $43,541 | $10,141 | $33,400 |
Source: Public Records
Map
Nearby Homes
- 15894 W 67th Place
- 6951 Nile Ct
- 15328 W 68th Ave
- 15336 W 68th Ave
- 15290 W 68th Place
- 15338 W 68th Ave
- 15336 68th Loop
- 15516 W 66th Dr Unit A
- 6836 Poppy Ct
- 15496 W 66th Dr Unit C
- 6476 Orion Way
- 15336 W 69th Dr
- 15492 W 65th Ave Unit C
- 15290 W 69th Place
- 15345 W 69th Dr
- 15325 W 69th Dr
- 15316 W 69th Dr
- 15312 W 69th Place
- 15194 W 69th Ave
- 15313 W 69th Ave
- 15794 W 67th Place
- 15734 W 67th Place
- 15765 W 67th Place
- 15704 W 67th Place
- 15795 W 67th Place
- 15735 W 67th Place
- 15835 W 67th Place
- 15834 W 67th Place
- 15694 W 67th Place
- 15705 W 67th Place
- 15865 W 67th Place
- 15695 W 67th Place
- 15864 W 67th Place
- 15895 W 67th Place
- 15773 W 66th Cir
- 15753 W 66th Cir
- 15793 W 66th Cir
- 15905 W 67th Place
- 15904 W 67th Place
- 15813 W 66th Cir