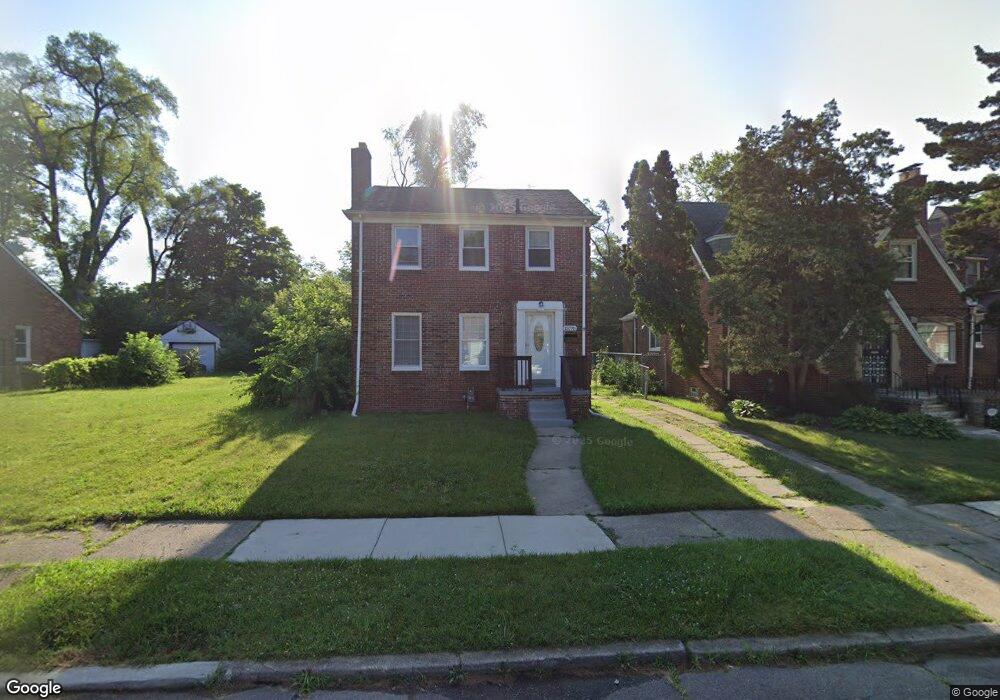
15770 Mansfield St Unit Bldg-Unit Detroit, MI 48227
Crary-Saint Marys NeighborhoodEstimated Value: $104,000 - $137,000
--
Bed
1
Bath
1,118
Sq Ft
$111/Sq Ft
Est. Value
About This Home
This home is located at 15770 Mansfield St Unit Bldg-Unit, Detroit, MI 48227 and is currently estimated at $124,566, approximately $111 per square foot. 15770 Mansfield St Unit Bldg-Unit is a home located in Wayne County with nearby schools including Young Coleman A. Elementary School, John R. King Academic And Performing Arts Academy, and Charles L. Spain Elementary-Middle School.
Ownership History
Date
Name
Owned For
Owner Type
Purchase Details
Closed on
Mar 27, 2025
Sold by
Ccivt Llc
Bought by
Ocean Investments International Lp
Current Estimated Value
Purchase Details
Closed on
Mar 14, 2025
Sold by
Thomas Marquis D
Bought by
Ccivt Llc
Purchase Details
Closed on
May 21, 2018
Sold by
Acp Roadmaster Llc
Bought by
Thomas Marquis D
Purchase Details
Closed on
Mar 7, 2014
Sold by
Summit Acquisitions Llc
Bought by
Acp Roadmaster Llc
Purchase Details
Closed on
Feb 15, 2014
Sold by
Artesian Equities Llc
Bought by
Summit Acquisitions Llc
Purchase Details
Closed on
Nov 16, 2012
Sold by
Wayne County Treasurer
Bought by
Artesian Equities Llc
Purchase Details
Closed on
Sep 20, 2004
Sold by
Mccrear Byron and Mccrear Marquetta
Bought by
Mccrear Byron
Create a Home Valuation Report for This Property
The Home Valuation Report is an in-depth analysis detailing your home's value as well as a comparison with similar homes in the area
Home Values in the Area
Average Home Value in this Area
Purchase History
| Date | Buyer | Sale Price | Title Company |
|---|---|---|---|
| Ocean Investments International Lp | $75,000 | None Listed On Document | |
| Ocean Investments International Lp | $75,000 | None Listed On Document | |
| Ccivt Llc | $35,000 | None Listed On Document | |
| Thomas Marquis | $65,000 | None Listed On Document | |
| Marquis Thomas | $65,000 | None Listed On Document | |
| Thomas Marquis D | -- | None Available | |
| Acp Roadmaster Llc | $5,000 | Bell Title Agency Of Livonia | |
| Summit Acquisitions Llc | -- | None Available | |
| Artesian Equities Llc | $3,011 | None Available | |
| Mccrear Byron | -- | Chirco Title Company |
Source: Public Records
Mortgage History
| Date | Status | Borrower | Loan Amount |
|---|---|---|---|
| Closed | Thomas Marquis D | $0 |
Source: Public Records
Tax History Compared to Growth
Tax History
| Year | Tax Paid | Tax Assessment Tax Assessment Total Assessment is a certain percentage of the fair market value that is determined by local assessors to be the total taxable value of land and additions on the property. | Land | Improvement |
|---|---|---|---|---|
| 2025 | $1,022 | $31,700 | $0 | $0 |
| 2024 | $1,022 | $26,600 | $0 | $0 |
| 2023 | $990 | $21,300 | $0 | $0 |
| 2022 | $1,097 | $18,400 | $0 | $0 |
| 2021 | $1,053 | $14,500 | $0 | $0 |
| 2020 | $1,042 | $14,400 | $0 | $0 |
| 2019 | $1,028 | $11,200 | $0 | $0 |
| 2018 | $795 | $10,000 | $0 | $0 |
| 2017 | $134 | $9,800 | $0 | $0 |
| 2016 | $863 | $10,300 | $0 | $0 |
| 2015 | $1,030 | $10,300 | $0 | $0 |
| 2013 | $2,350 | $23,502 | $0 | $0 |
| 2010 | -- | $34,457 | $978 | $33,479 |
Source: Public Records
Map
Nearby Homes
- 15763 Mansfield St
- 15786 Mansfield St
- 15785 Rutherford St
- 15721 Mansfield St
- 15710 Rutherford St
- 15786 Rutherford St
- 15508 Mansfield St
- 15835 Rutherford St
- 15866 Mansfield St
- 15515 Forrer St
- 15465 Murray Hill St
- 15480 Asbury Park
- 15900 Murray Hill St
- 15791 Asbury Park
- 15454 Asbury Park
- 15872 Asbury Park
- 15744 Ferguson St
- 15342 Mansfield St
- 15762 Winthrop St
- 15333 Rutherford St
- 15764 Mansfield St
- 15781 Rutherford St
- 15758 Mansfield St
- 15780 Mansfield St
- 15752 Mansfield St
- 15771 Rutherford St
- 15763 Rutherford St
- 15775 Rutherford St
- 15759 Rutherford St
- 15748 Mansfield St
- 15791 Rutherford St
- 15755 Rutherford St
- 15767 Mansfield St
- 15775 Mansfield St
- 15779 Mansfield St
- 15744 Mansfield St
- 15743 Rutherford St
- 15790 Mansfield St
- 15747 Mansfield St
- 15734 Mansfield St