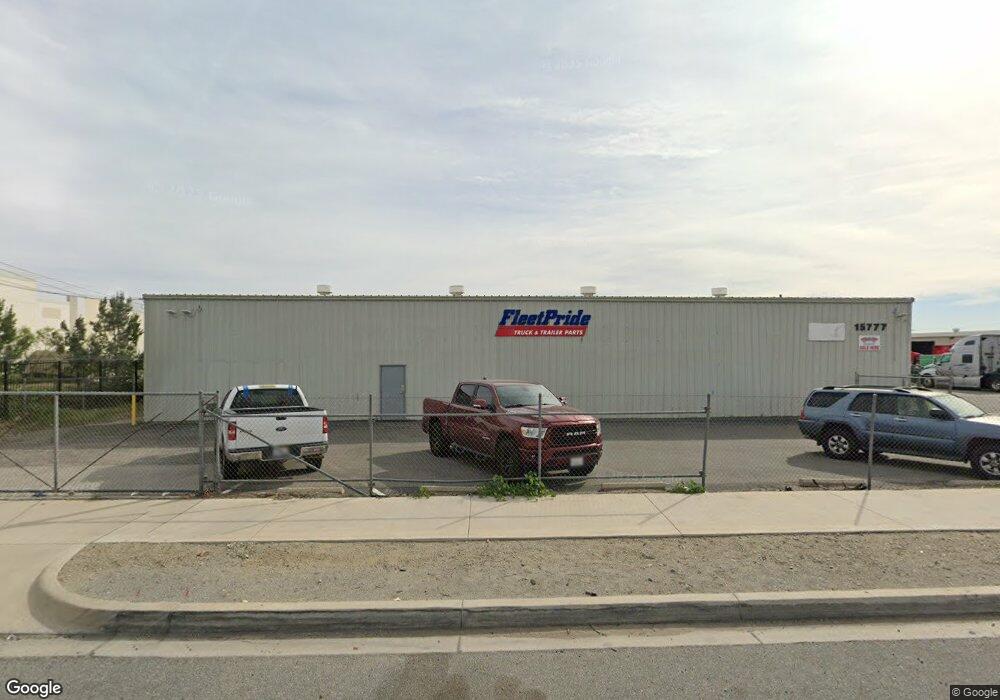
15777 Valley Blvd Fontana, CA 92335
Estimated Value: $5,705,773
--
Bed
--
Bath
50,200
Sq Ft
$114/Sq Ft
Est. Value
About This Home
This home is located at 15777 Valley Blvd, Fontana, CA 92335 and is currently estimated at $5,705,773, approximately $113 per square foot. 15777 Valley Blvd is a home located in San Bernardino County with nearby schools including Poplar Elementary School, Harry S. Truman Middle School, and Jurupa Hills High School.
Ownership History
Date
Name
Owned For
Owner Type
Purchase Details
Closed on
Feb 25, 2015
Sold by
Treasure Island Investments Llc
Bought by
Hager Pacific Properties Llc and Dolin Property Investments Llc
Current Estimated Value
Purchase Details
Closed on
Mar 5, 2007
Sold by
Treasure Island Investments Llc
Bought by
City Of Fontana
Purchase Details
Closed on
Mar 21, 2000
Sold by
The Gloria J Dull 1980 Trust
Bought by
Treasur Island Investments Llc
Purchase Details
Closed on
Mar 6, 2000
Sold by
Dull Brian T
Bought by
Treasure Island Investments Llc
Purchase Details
Closed on
Oct 19, 1999
Sold by
Dull Harry Family Trust
Bought by
Treasure Island Investments Llc
Create a Home Valuation Report for This Property
The Home Valuation Report is an in-depth analysis detailing your home's value as well as a comparison with similar homes in the area
Home Values in the Area
Average Home Value in this Area
Purchase History
| Date | Buyer | Sale Price | Title Company |
|---|---|---|---|
| Hager Pacific Properties Llc | $2,700,000 | North American Title Company | |
| City Of Fontana | -- | None Available | |
| Treasur Island Investments Llc | -- | -- | |
| Treasure Island Investments Llc | -- | -- | |
| Dull Brian T | -- | -- | |
| Treasure Island Investments Llc | -- | -- |
Source: Public Records
Tax History Compared to Growth
Tax History
| Year | Tax Paid | Tax Assessment Tax Assessment Total Assessment is a certain percentage of the fair market value that is determined by local assessors to be the total taxable value of land and additions on the property. | Land | Improvement |
|---|---|---|---|---|
| 2025 | $33,630 | $3,244,996 | $1,412,175 | $1,832,821 |
| 2024 | $33,630 | $3,181,368 | $1,384,485 | $1,796,883 |
| 2023 | $32,760 | $3,118,988 | $1,357,338 | $1,761,650 |
| 2022 | $32,629 | $3,057,832 | $1,330,724 | $1,727,108 |
| 2021 | $32,219 | $2,997,874 | $1,304,631 | $1,693,243 |
| 2020 | $32,141 | $2,967,135 | $1,291,254 | $1,675,881 |
| 2019 | $31,160 | $2,908,956 | $1,265,935 | $1,643,021 |
| 2018 | $31,639 | $2,851,918 | $1,241,113 | $1,610,805 |
| 2017 | $31,462 | $2,795,998 | $1,216,777 | $1,579,221 |
| 2016 | $31,111 | $3,312,761 | $1,192,919 | $2,119,842 |
| 2015 | $36,895 | $3,263,000 | $1,175,000 | $2,088,000 |
| 2014 | $37,662 | $3,263,000 | $1,175,000 | $2,088,000 |
Source: Public Records
Map
Nearby Homes
- 15082 Valley Blvd
- 9963 Eugenia Ave
- 14770 Boyle Ave
- 15798 Slover Ave
- 9756 Elm Ave
- 15937 Manzanita Dr
- 15278 Boyle Ave
- 10149 Oleander Ave
- 9828 Carob Ave
- 9831 Oleander Ave
- 17377 20 Valley Blvd
- 9408 Poplar Ave
- 15939 Tyrol Dr
- 16448 Washington Dr
- 15994 Sequoia Ave
- 15162 Cambria St
- 9906 Cypress Ave
- 9850 Cypress Ave
- 9825 Chantry Ave
- 15240 Carob Ln
- 14336 Valley Blvd
- 16655 Valley Blvd
- 15762 Valley Blvd
- 10060 Poplar Ave
- 10207 Poplar Ave
- 9970 Almeria Ave
- 15697 Iris Dr
- 15685 Iris Dr
- 9972 Almeria Ave
- 15673 Iris Dr
- 9968 Almeria Ave
- 15661 Iris Dr
- 9968 Almeria Ct
- 9974 Poplar Ave
- 15649 Iris Dr
- 9982 Almeria Ave
- 10053 Catawba Ave
- 9986 Almeria Ave
- 9978 Almeria Ave
- 9973 Eugenia Ave