Estimated Value: $714,257 - $756,000
4
Beds
3
Baths
2,211
Sq Ft
$334/Sq Ft
Est. Value
About This Home
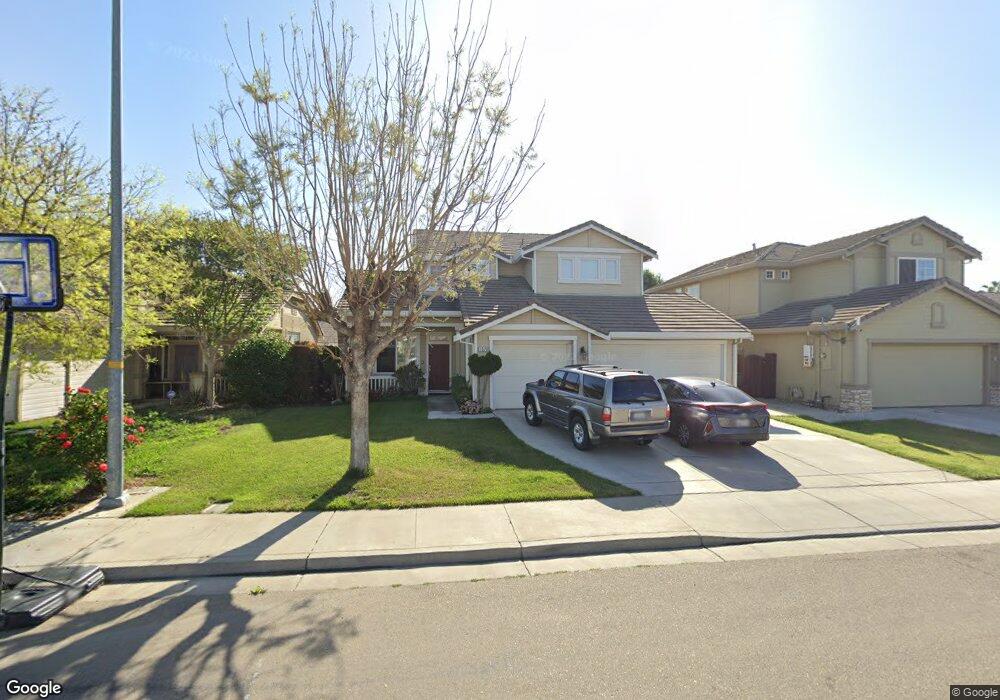
This home is located at 1578 Cindy Way, Tracy, CA 95377 and is currently estimated at $737,814, approximately $333 per square foot. 1578 Cindy Way is a home located in San Joaquin County with nearby schools including Art Freiler, Merrill F. West High School, and Tracy Independent Study Charter School.
Ownership History
Date
Name
Owned For
Owner Type
Purchase Details
Closed on
Mar 23, 2005
Sold by
Harmsen Dirk and Harmsen Holly
Bought by
Rozales Anthony and Rozales Maria Asuncion G
Current Estimated Value
Home Financials for this Owner
Home Financials are based on the most recent Mortgage that was taken out on this home.
Original Mortgage
$443,200
Outstanding Balance
$219,312
Interest Rate
5.25%
Mortgage Type
Purchase Money Mortgage
Estimated Equity
$518,502
Purchase Details
Closed on
Sep 19, 2001
Sold by
Cook Joel G and Cook Leslie A
Bought by
Harmsen Dirk and Harmsen Holly
Home Financials for this Owner
Home Financials are based on the most recent Mortgage that was taken out on this home.
Original Mortgage
$264,000
Interest Rate
6.91%
Purchase Details
Closed on
Jan 1, 1999
Sold by
Morrison Homes Inc
Bought by
Cook Joel G and Cook Leslie A
Home Financials for this Owner
Home Financials are based on the most recent Mortgage that was taken out on this home.
Original Mortgage
$221,600
Interest Rate
6.63%
Create a Home Valuation Report for This Property
The Home Valuation Report is an in-depth analysis detailing your home's value as well as a comparison with similar homes in the area
Home Values in the Area
Average Home Value in this Area
Purchase History
| Date | Buyer | Sale Price | Title Company |
|---|---|---|---|
| Rozales Anthony | $554,000 | Old Republic Title Co | |
| Harmsen Dirk | $330,000 | Fidelity National Title Co | |
| Cook Joel G | $239,000 | First American |
Source: Public Records
Mortgage History
| Date | Status | Borrower | Loan Amount |
|---|---|---|---|
| Open | Rozales Anthony | $443,200 | |
| Previous Owner | Harmsen Dirk | $264,000 | |
| Previous Owner | Cook Joel G | $221,600 | |
| Closed | Rozales Anthony | $55,400 |
Source: Public Records
Tax History
| Year | Tax Paid | Tax Assessment Tax Assessment Total Assessment is a certain percentage of the fair market value that is determined by local assessors to be the total taxable value of land and additions on the property. | Land | Improvement |
|---|---|---|---|---|
| 2025 | $8,625 | $742,200 | $220,000 | $522,200 |
| 2024 | $7,937 | $726,300 | $215,000 | $511,300 |
| 2023 | $7,528 | $686,000 | $205,000 | $481,000 |
| 2022 | $7,886 | $686,000 | $205,000 | $481,000 |
| 2021 | $7,773 | $597,000 | $120,000 | $477,000 |
| 2020 | $6,387 | $470,500 | $120,000 | $350,500 |
| 2019 | $6,351 | $470,500 | $120,000 | $350,500 |
| 2018 | $6,331 | $470,500 | $120,000 | $350,500 |
| 2017 | $6,153 | $465,000 | $185,000 | $280,000 |
| 2016 | $6,035 | $436,000 | $174,000 | $262,000 |
| 2014 | $5,303 | $381,000 | $152,000 | $229,000 |
Source: Public Records
Map
Nearby Homes
- 2306 Sabrina Way
- 2431 Ogden Sannazor Ct
- 2231 Hillcrest Dr
- 1233 Plaza Ct
- 2685 Remy Javier St
- 1890 Spring Valley Way
- 1572 Cole Ln
- 2919 Kennsington Ln
- 2902 Campbell Ln
- 2963 Rugby Ct
- 3030 W Byron Rd
- 1294 Dover Ln
- 2219 Yellowstone Ave
- 1214 Dover Ln
- 1830 Laurelgrove Ln
- 8300 W 11th St
- 1533 Vinewood Way
- 2431 Garrett Ct
- 1974 Paradise Valley Ct
- 1800 Duncan Dr
- 1588 Cindy Way
- 1568 Cindy Way
- 1567 Arrigotti Ln
- 1577 Arrigotti Ln
- 1558 Cindy Way
- 1598 Cindy Way
- 1557 Arrigotti Ln
- 1587 Arrigotti Ln
- 1579 Cindy Way
- 1589 Cindy Way
- 1569 Cindy Way
- 1548 Cindy Way
- 1547 Arrigotti Ln
- 1597 Arrigotti Ln
- 1559 Cindy Way
- 1599 Cindy Way
- 1537 Arrigotti Ln
- 1538 Cindy Way
- 1549 Cindy Way
- 1609 Cindy Way
Your Personal Tour Guide
Ask me questions while you tour the home.