1579 470th Ave Montezuma, IA 50171
Estimated Value: $374,000 - $484,331
1
Bed
3
Baths
2,352
Sq Ft
$185/Sq Ft
Est. Value
About This Home
This home is located at 1579 470th Ave, Montezuma, IA 50171 and is currently estimated at $434,583, approximately $184 per square foot. 1579 470th Ave is a home with nearby schools including Montezuma Elementary School and Montezuma Junior High School.
Ownership History
Date
Name
Owned For
Owner Type
Purchase Details
Closed on
May 26, 2020
Sold by
Roorda John A
Bought by
Morris Stephanie and Beatty Gregory
Current Estimated Value
Home Financials for this Owner
Home Financials are based on the most recent Mortgage that was taken out on this home.
Original Mortgage
$248,000
Outstanding Balance
$219,347
Interest Rate
3.2%
Mortgage Type
New Conventional
Estimated Equity
$215,236
Purchase Details
Closed on
Sep 20, 2018
Sold by
Merck Lynn E and Merck Donna R
Bought by
Roorda John A
Home Financials for this Owner
Home Financials are based on the most recent Mortgage that was taken out on this home.
Original Mortgage
$400,000
Interest Rate
4.5%
Mortgage Type
Credit Line Revolving
Create a Home Valuation Report for This Property
The Home Valuation Report is an in-depth analysis detailing your home's value as well as a comparison with similar homes in the area
Home Values in the Area
Average Home Value in this Area
Purchase History
| Date | Buyer | Sale Price | Title Company |
|---|---|---|---|
| Morris Stephanie | $310,000 | None Available | |
| Roorda John A | $270,000 | -- |
Source: Public Records
Mortgage History
| Date | Status | Borrower | Loan Amount |
|---|---|---|---|
| Open | Morris Stephanie | $248,000 | |
| Previous Owner | Roorda John A | $400,000 |
Source: Public Records
Tax History Compared to Growth
Tax History
| Year | Tax Paid | Tax Assessment Tax Assessment Total Assessment is a certain percentage of the fair market value that is determined by local assessors to be the total taxable value of land and additions on the property. | Land | Improvement |
|---|---|---|---|---|
| 2025 | $3,210 | $347,580 | $109,230 | $238,350 |
| 2024 | $3,336 | $327,970 | $98,400 | $229,570 |
| 2023 | $3,338 | $327,970 | $98,400 | $229,570 |
| 2022 | $3,366 | $275,420 | $78,720 | $196,700 |
| 2021 | $3,366 | $259,830 | $74,260 | $185,570 |
| 2020 | $2,418 | $178,430 | $15,530 | $162,900 |
| 2019 | $2,012 | $178,430 | $15,530 | $162,900 |
Source: Public Records
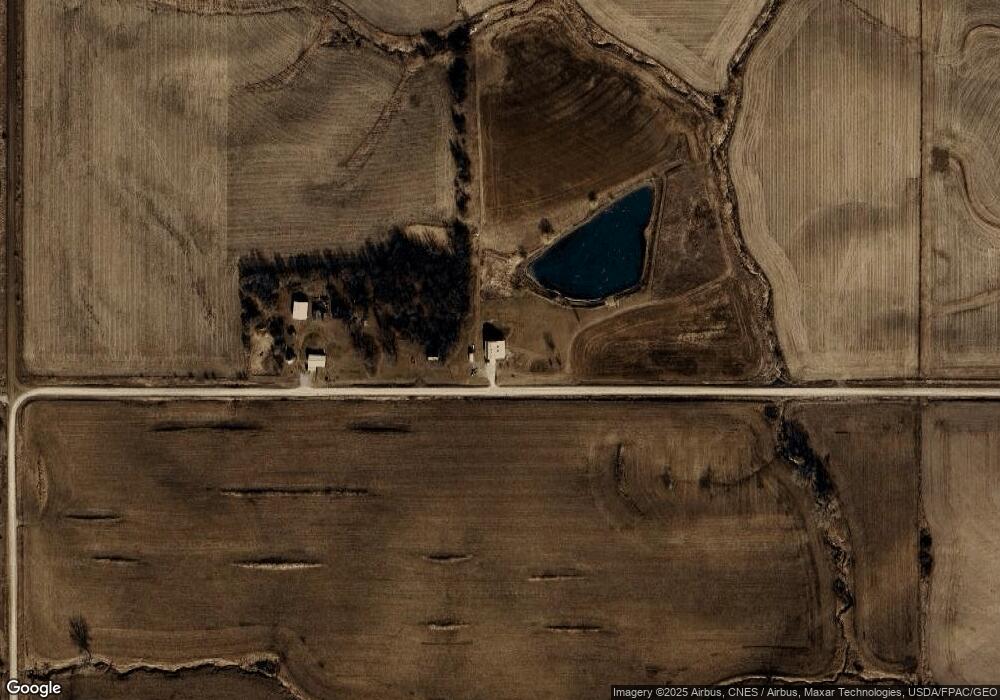
Map
Nearby Homes