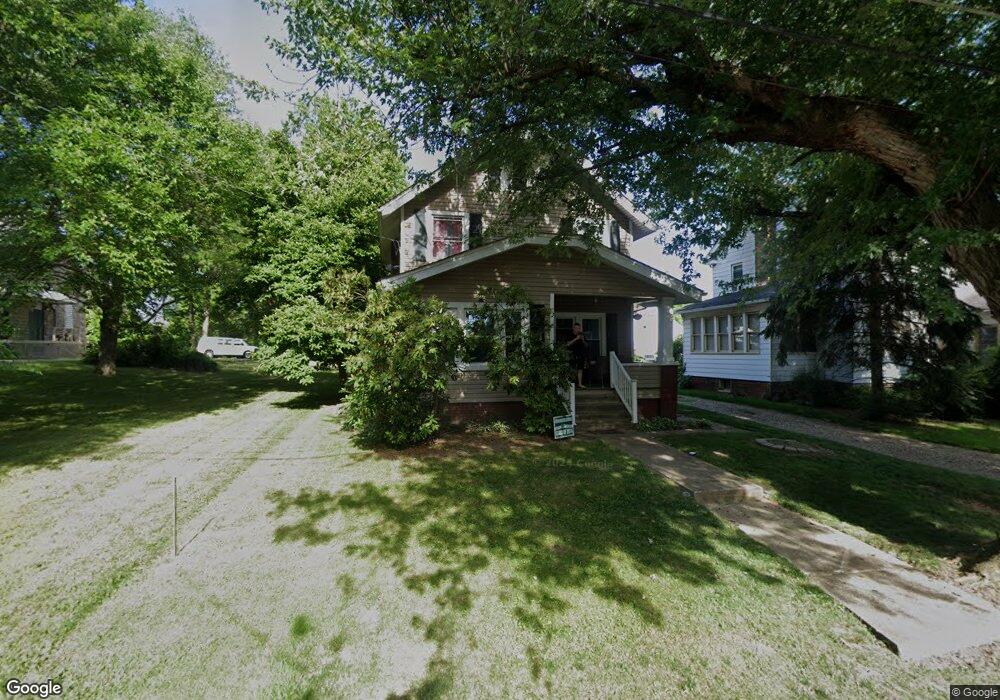
158 23rd St SE Massillon, OH 44646
New England NeighborhoodEstimated Value: $132,500
4
Beds
1
Bath
1,440
Sq Ft
$92/Sq Ft
Est. Value
About This Home
This home is located at 158 23rd St SE, Massillon, OH 44646 and is currently priced at $132,500, approximately $92 per square foot. 158 23rd St SE is a home located in Stark County with nearby schools including Massillon Intermediate School, Massillon Junior High School, and Washington High School.
Ownership History
Date
Name
Owned For
Owner Type
Purchase Details
Closed on
Jul 15, 2022
Sold by
K S Yoak Enterprises Llc
Bought by
Blackwood Justin Michael and Blackwood Whitney
Current Estimated Value
Home Financials for this Owner
Home Financials are based on the most recent Mortgage that was taken out on this home.
Original Mortgage
$90,500
Outstanding Balance
$86,593
Interest Rate
5.78%
Mortgage Type
New Conventional
Purchase Details
Closed on
Dec 22, 2021
Sold by
Ollis Steven A and Ollis Steve A
Bought by
K S Yoak Enterprises Llc
Purchase Details
Closed on
Aug 10, 2021
Sold by
Estate Of Debra J Ollis
Bought by
Ollis Steven A
Purchase Details
Closed on
Jan 9, 2012
Sold by
Barbera Properties Ltd
Bought by
State Of Ohio
Purchase Details
Closed on
Nov 22, 1993
Create a Home Valuation Report for This Property
The Home Valuation Report is an in-depth analysis detailing your home's value as well as a comparison with similar homes in the area
Home Values in the Area
Average Home Value in this Area
Purchase History
| Date | Buyer | Sale Price | Title Company |
|---|---|---|---|
| Blackwood Justin Michael | -- | Kay Ryan M | |
| K S Yoak Enterprises Llc | $50,000 | None Available | |
| Ollis Steven A | -- | None Available | |
| State Of Ohio | $1,570 | Attorney | |
| -- | $45,500 | -- |
Source: Public Records
Mortgage History
| Date | Status | Borrower | Loan Amount |
|---|---|---|---|
| Open | Blackwood Justin Michael | $90,500 |
Source: Public Records
Tax History Compared to Growth
Tax History
| Year | Tax Paid | Tax Assessment Tax Assessment Total Assessment is a certain percentage of the fair market value that is determined by local assessors to be the total taxable value of land and additions on the property. | Land | Improvement |
|---|---|---|---|---|
| 2021 | $1,570 | $32,240 | $7,980 | $24,260 |
| 2020 | $1,337 | $26,640 | $6,550 | $20,090 |
| 2019 | $1,318 | $26,650 | $6,550 | $20,100 |
| 2018 | $1,303 | $26,650 | $6,550 | $20,100 |
| 2017 | $1,561 | $24,580 | $5,360 | $19,220 |
| 2016 | $1,477 | $23,280 | $5,360 | $17,920 |
| 2015 | $1,163 | $23,280 | $5,360 | $17,920 |
| 2014 | $1,389 | $22,540 | $5,180 | $17,360 |
| 2013 | $1,049 | $22,540 | $5,180 | $17,360 |
Source: Public Records
Map
Nearby Homes
- 2312 Massachusetts Ave SE
- 156 24th St SE
- 2020 Massachusetts Ave SE
- 2201 Cambridge Ave SE
- 229 25th St SE
- 0 Connecticut Ave SE
- 2221 Oak Ave SE
- 174 26th St SE
- 302 Jackson Ave NW
- 2410 Tanglewood Dr NE
- 518 Jackson Ave NW
- 1837 Lindbergh Ave NE
- 840 Bittersweet Dr NE
- 1720 Lincoln Way E
- 831 27th St NE
- 727 Franklin Rd NE
- 860 Franklin Rd NE
- 719 17th St NE
- 937 27th St NE
- 1706 Jefferson Rd NE
- 166 23rd St SE
- 6372 Lot Massachusetts Ave SE
- 152 Wall Place SE
- 159 23rd St SE
- 167 23rd St SE
- 147 23rd St SE
- 178 Wall Place SE
- 141 23rd St SE
- 122 23rd St SE
- 131 23rd St SE
- 2333 Lincoln Way E
- 137 24th St SE
- 2341 Lincoln Way E
- 2210 Massachusetts Ave SE
- 149 24th St SE
- 155 24th St SE
- 148 22nd St SE
- 2329 Lincoln Way E
- 173 24th St SE
- 127 24th St SE