
Seller's Agent in 2025
Jessica Boswell
LPT Realty
(860) 777-0703
3 in this area
568 Total Sales
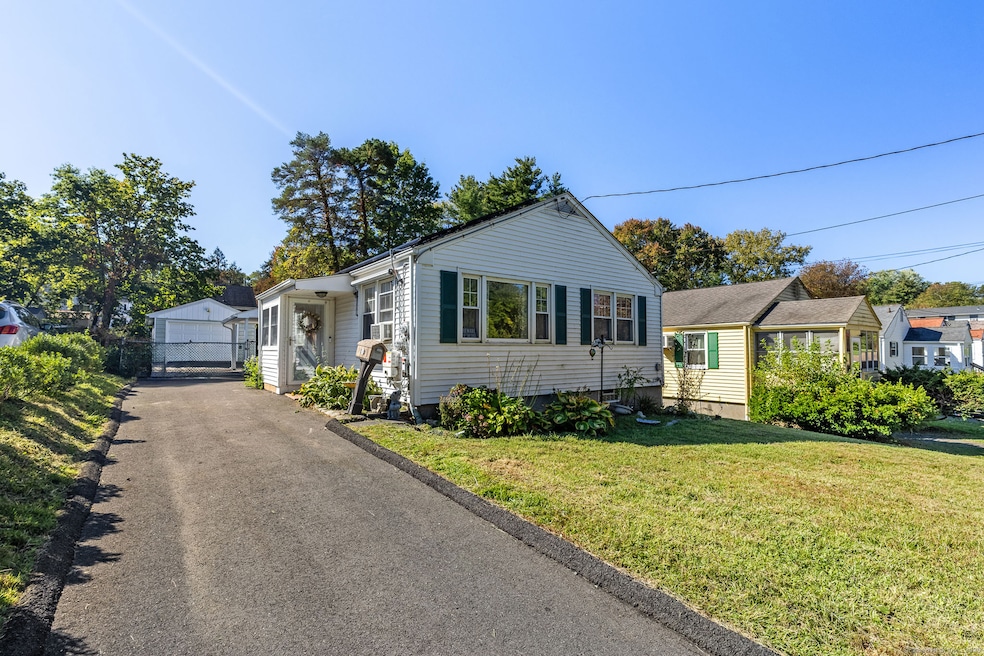
Highest & Best due today, 10/13 by 5:00 PM. Welcome to 158 Colton Street, a bright and comfortable home tucked into a peaceful Windsor neighborhood. This well-maintained property offers 2 main floor bedrooms, 1.5 bathrooms, additional lower level living space, and a detached garage. Ideal for everyday living with room to grow. When entering the home, natural light fills the living area, creating a warm and welcoming atmosphere. The kitchen/dining space features tile flooring and classic wooden cabinetry, blending functionality with timeless charm. Just off the kitchen, the sunroom is a true standout - with lovely wood finishes that open directly to the back porch and yard. It's the perfect space to relax, entertain, or enjoy a quiet morning. The basement expands the home's versatility, with a finished bedroom, another potential office space, laundry area, and a convenient half bath. Out back, the partially fenced yard offers a secluded area to enjoy barbecues, gardening, or summer fun with family and friends. The home has seen thoughtful updates over the years, including a renovated basement, a newer roof, a modern walk-in shower, hardwood and tile flooring upstairs, cozy carpeting in the basement and a newer furnace - offering peace of mind for years to come. Situated near Windsor Meadows State Park and Northwest Park, outdoor enthusiasts will appreciate access to trails, river walks, and green spaces.
Last Agent to Sell the Property
LPT Realty Brokerage Phone: (860) 357-0704 License #RES.0807833 Listed on: 10/08/2025
| Date | Type | Sale Price | Title Company |
|---|---|---|---|
| Executors Deed | $293,000 | -- | |
| Warranty Deed | $149,000 | -- | |
| Quit Claim Deed | $40,000 | -- | |
| Warranty Deed | $140,000 | -- |
| Date | Status | Loan Amount | Loan Type |
|---|---|---|---|
| Open | $213,000 | New Conventional | |
| Previous Owner | $146,301 | FHA |
| Date | Event | Price | List to Sale | Price per Sq Ft |
|---|---|---|---|---|
| 11/21/2025 11/21/25 | Sold | $293,000 | +5.0% | $193 / Sq Ft |
| 10/16/2025 10/16/25 | Pending | -- | -- | -- |
| 10/08/2025 10/08/25 | For Sale | $279,000 | -- | $184 / Sq Ft |
| Year | Tax Paid | Tax Assessment Tax Assessment Total Assessment is a certain percentage of the fair market value that is determined by local assessors to be the total taxable value of land and additions on the property. | Land | Improvement |
|---|---|---|---|---|
| 2025 | $4,047 | $142,240 | $45,360 | $96,880 |
| 2024 | $4,313 | $142,240 | $45,360 | $96,880 |
| 2023 | $3,123 | $92,960 | $32,480 | $60,480 |
| 2022 | $3,093 | $92,960 | $32,480 | $60,480 |
| 2021 | $3,093 | $92,960 | $32,480 | $60,480 |
| 2020 | $3,078 | $92,960 | $32,480 | $60,480 |
| 2019 | $3,010 | $92,960 | $32,480 | $60,480 |
| 2018 | $2,912 | $88,340 | $32,480 | $55,860 |
| 2017 | $2,867 | $88,340 | $32,480 | $55,860 |
| 2016 | $2,784 | $88,340 | $32,480 | $55,860 |
| 2015 | $2,731 | $88,340 | $32,480 | $55,860 |
| 2014 | $2,692 | $88,340 | $32,480 | $55,860 |
Seller's Agent in 2025
Jessica Boswell
LPT Realty
(860) 777-0703
3 in this area
568 Total Sales
A
Seller Co-Listing Agent in 2025
Ayanna Douglas
LPT Realty
(866) 828-3951
1 in this area
10 Total Sales
Buyer's Agent in 2025
Melissa Kiehl
KW Legacy Partners
(860) 480-4169
2 in this area
114 Total Sales
Source: SmartMLS
MLS Number: 24129522
APN: WIND-000079-000057-000007
Disclaimer: Certain information contained herein is derived from information provided by parties other than Homes.com. All information provided is deemed reliable, but is not guaranteed to be accurate and should be independently verified.
![]() IDX information is provided exclusively for personal, non-commercial use, and may not be used for any purpose other than to identify prospective properties consumers may be interested in purchasing. Information is deemed reliable but not guaranteed.
IDX information is provided exclusively for personal, non-commercial use, and may not be used for any purpose other than to identify prospective properties consumers may be interested in purchasing. Information is deemed reliable but not guaranteed.