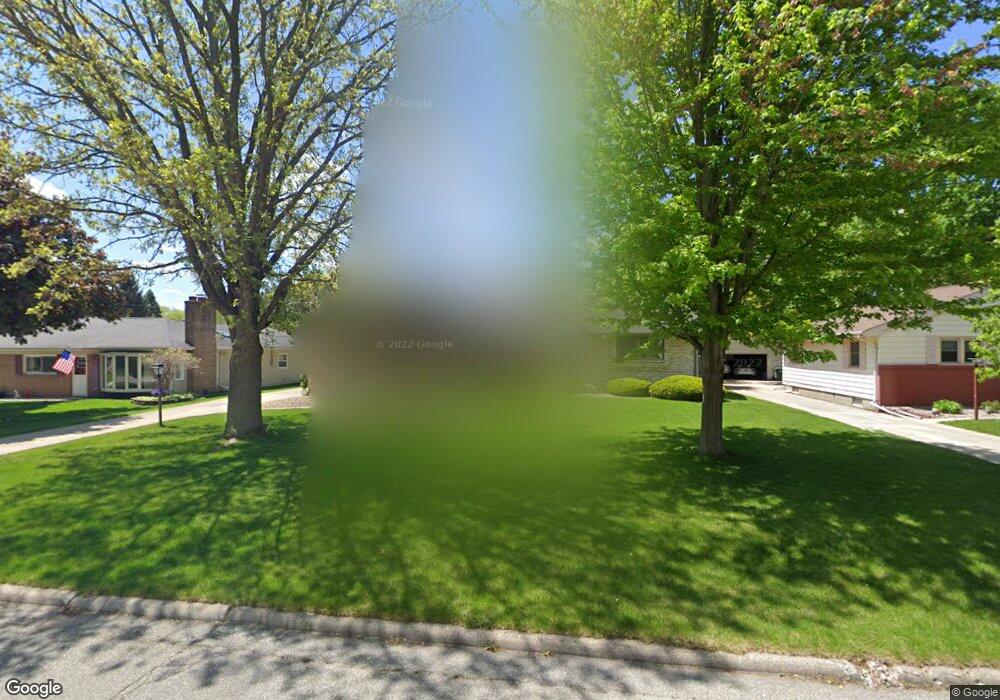
158 Crestview Ave Waterloo, IA 50701
Estimated Value: $286,000 - $352,000
4
Beds
3
Baths
2,704
Sq Ft
$118/Sq Ft
Est. Value
About This Home
This home is located at 158 Crestview Ave, Waterloo, IA 50701 and is currently estimated at $319,843, approximately $118 per square foot. 158 Crestview Ave is a home located in Black Hawk County with nearby schools including Lou Henry Elementary School, Hoover Middle School, and West High School.
Ownership History
Date
Name
Owned For
Owner Type
Purchase Details
Closed on
Jul 15, 2020
Sold by
Eva F Knutson Revocable Trust and Knutson Kurt A
Bought by
Ngandu Christine
Current Estimated Value
Purchase Details
Closed on
May 24, 2017
Sold by
Neal Rosen
Bought by
Weidner Steven and Weidner Katherine
Home Financials for this Owner
Home Financials are based on the most recent Mortgage that was taken out on this home.
Original Mortgage
$207,200
Interest Rate
4.02%
Purchase Details
Closed on
Jun 17, 2016
Sold by
Rosen Lionel Guy
Bought by
Rosen Lionel Guy and Lionel Guy Rosen Revocable Trust
Purchase Details
Closed on
Apr 18, 2005
Sold by
Rosen Melba
Bought by
Rosen Lionel Guy and Rosen Melba
Create a Home Valuation Report for This Property
The Home Valuation Report is an in-depth analysis detailing your home's value as well as a comparison with similar homes in the area
Purchase History
| Date | Buyer | Sale Price | Title Company |
|---|---|---|---|
| Ngandu Christine | $187,500 | Title Services | |
| Ngandu Christine B | $187,500 | Title Services | |
| Weidner Steven | -- | -- | |
| Rosen Lionel Guy | -- | None Available | |
| Rosen Lionel Guy | -- | None Available | |
| Rosen Lionel Guy | -- | None Available |
Source: Public Records
Mortgage History
| Date | Status | Borrower | Loan Amount |
|---|---|---|---|
| Previous Owner | Weidner Steven | $207,200 | |
| Previous Owner | Weidner Steven | -- |
Source: Public Records
Tax History
| Year | Tax Paid | Tax Assessment Tax Assessment Total Assessment is a certain percentage of the fair market value that is determined by local assessors to be the total taxable value of land and additions on the property. | Land | Improvement |
|---|---|---|---|---|
| 2025 | $5,872 | $347,100 | $33,460 | $313,640 |
| 2024 | $5,872 | $303,080 | $33,460 | $269,620 |
| 2023 | $5,248 | $303,080 | $33,460 | $269,620 |
| 2022 | $5,106 | $251,190 | $33,460 | $217,730 |
| 2021 | $4,922 | $251,190 | $33,460 | $217,730 |
| 2020 | $4,836 | $229,200 | $27,180 | $202,020 |
| 2019 | $4,836 | $229,200 | $27,180 | $202,020 |
| 2018 | $4,964 | $223,210 | $27,180 | $196,030 |
| 2017 | $4,964 | $222,610 | $27,180 | $195,430 |
| 2016 | $4,776 | $222,610 | $27,180 | $195,430 |
| 2015 | $4,776 | $222,610 | $27,180 | $195,430 |
| 2014 | $4,618 | $211,760 | $27,180 | $184,580 |
Source: Public Records
Map
Nearby Homes
- 1119 Rachael St
- 1037 Rachael St
- 3325 Lincolnshire Rd
- 3329 Lincolnshire Rd
- 3335 Lincolnshire Rd
- Lot 10 Paradise Estates First Addition
- Lot 44 Paradise Estates First Addition
- Lot 29 Paradise Estates First Addition
- Lot 1
- Lot 27 Paradise Estates First Addition
- Lot 54 Paradise Estates First Addition
- Lot 63 Paradise Estates First Addition
- Lot 39 Paradise Estates First Addition
- Lot 42 Paradise Estates First Addition
- Lot 13 Paradise Estates First Addition
- Lot 41 Paradise Estates First Addition
- Lot 14 Paradise Estates First Addition
- Lot 61 Paradise Estates First Addition
- Lot 53 Paradise Estates First Addition
- Lot 55 Paradise Estates First Addition
- 166 Crestview Ave
- 150 Crestview Ave
- 3331 Rosehill Terrace
- 142 Crestview Ave
- 3341 Rosehill Terrace
- 1008 Hilltop Rd
- 3321 Rosehill Terrace
- 159 Crestview Ave
- 167 Crestview Ave
- 151 Crestview Ave
- 3311 Rosehill Terrace
- 134 Crestview Ave
- 145 Crestview Ave
- 175 Crestview Ave
- 135 Crestview Ave
- 3305 Rosehill Terrace
- 124 Crestview Ave
- 206 Crestview Ave
- 3332 Rosehill Terrace
- 1025 Hilltop Rd
Your Personal Tour Guide
Ask me questions while you tour the home.