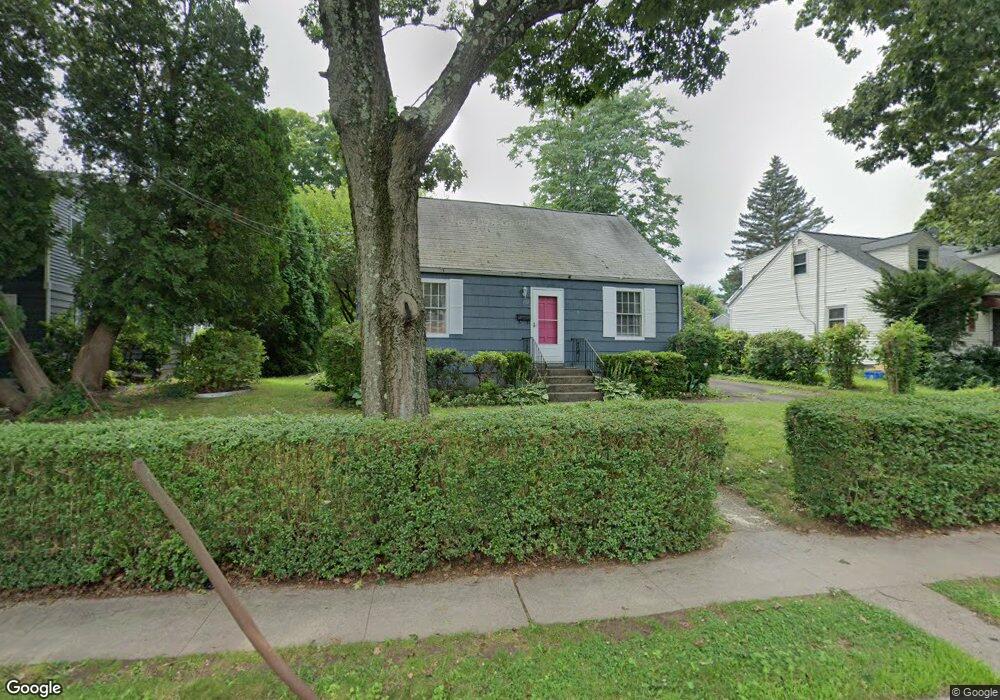
158 Mitchell Dr New Haven, CT 06511
East Rock NeighborhoodEstimated Value: $419,309 - $652,000
3
Beds
1
Bath
1,152
Sq Ft
$432/Sq Ft
Est. Value
About This Home
This home is located at 158 Mitchell Dr, New Haven, CT 06511 and is currently estimated at $497,577, approximately $431 per square foot. 158 Mitchell Dr is a home located in New Haven County with nearby schools including St. Thomas's Day School and The Foote School.
Ownership History
Date
Name
Owned For
Owner Type
Purchase Details
Closed on
Jul 12, 2002
Sold by
Sargrey Andrea
Bought by
Digiovanni Steven R and Brownell Diana D
Current Estimated Value
Home Financials for this Owner
Home Financials are based on the most recent Mortgage that was taken out on this home.
Original Mortgage
$128,000
Interest Rate
6.79%
Purchase Details
Closed on
Jul 28, 1997
Sold by
Spillane Mary A Est
Bought by
Sangrey Andrea
Create a Home Valuation Report for This Property
The Home Valuation Report is an in-depth analysis detailing your home's value as well as a comparison with similar homes in the area
Home Values in the Area
Average Home Value in this Area
Purchase History
| Date | Buyer | Sale Price | Title Company |
|---|---|---|---|
| Digiovanni Steven R | $160,000 | -- | |
| Sangrey Andrea | $45,000 | -- |
Source: Public Records
Mortgage History
| Date | Status | Borrower | Loan Amount |
|---|---|---|---|
| Open | Sangrey Andrea | $105,000 | |
| Closed | Sangrey Andrea | $128,000 | |
| Previous Owner | Sangrey Andrea | $100,000 |
Source: Public Records
Tax History
| Year | Tax Paid | Tax Assessment Tax Assessment Total Assessment is a certain percentage of the fair market value that is determined by local assessors to be the total taxable value of land and additions on the property. | Land | Improvement |
|---|---|---|---|---|
| 2025 | $8,930 | $226,660 | $135,730 | $90,930 |
| 2024 | $8,726 | $226,660 | $135,730 | $90,930 |
| 2023 | $8,432 | $226,660 | $135,730 | $90,930 |
| 2022 | $9,010 | $226,660 | $135,730 | $90,930 |
| 2021 | $7,470 | $170,240 | $104,230 | $66,010 |
| 2020 | $7,470 | $170,240 | $104,230 | $66,010 |
| 2019 | $7,317 | $170,240 | $104,230 | $66,010 |
| 2018 | $7,317 | $170,240 | $104,230 | $66,010 |
| 2017 | $6,585 | $170,240 | $104,230 | $66,010 |
| 2016 | $7,344 | $176,750 | $114,450 | $62,300 |
| 2015 | $7,344 | $176,750 | $114,450 | $62,300 |
| 2014 | $7,344 | $176,750 | $114,450 | $62,300 |
Source: Public Records
Map
Nearby Homes
Your Personal Tour Guide
Ask me questions while you tour the home.