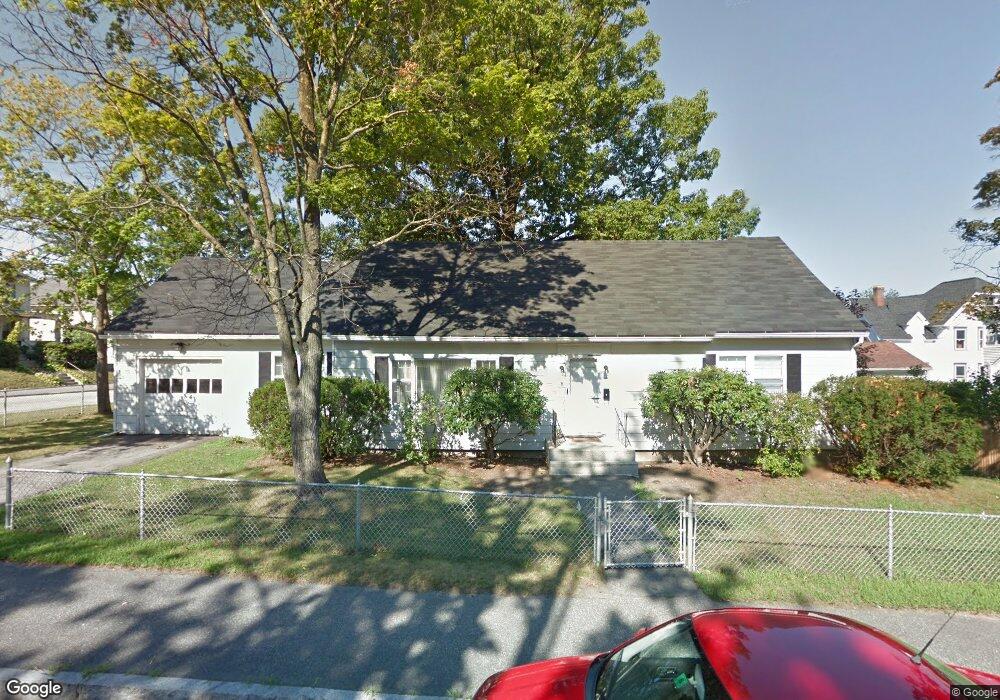
158 Oak St Manchester, NH 03104
Straw-Smyth NeighborhoodEstimated Value: $461,920 - $505,000
3
Beds
1
Bath
1,671
Sq Ft
$293/Sq Ft
Est. Value
About This Home
This home is located at 158 Oak St, Manchester, NH 03104 and is currently estimated at $489,980, approximately $293 per square foot. 158 Oak St is a home located in Hillsborough County with nearby schools including Smyth Road School, Hillside Middle School, and Manchester Central High School.
Ownership History
Date
Name
Owned For
Owner Type
Purchase Details
Closed on
Nov 1, 2021
Sold by
Thomas L Martone Lt
Bought by
Oak Brook Investments Llc
Current Estimated Value
Purchase Details
Closed on
Nov 22, 2013
Sold by
Martone Thomas L
Bought by
Thomas L Martone Lt
Purchase Details
Closed on
Jul 31, 1998
Sold by
Littlefield Durwood E
Bought by
Martone Thomas L
Home Financials for this Owner
Home Financials are based on the most recent Mortgage that was taken out on this home.
Original Mortgage
$90,000
Interest Rate
6.92%
Create a Home Valuation Report for This Property
The Home Valuation Report is an in-depth analysis detailing your home's value as well as a comparison with similar homes in the area
Home Values in the Area
Average Home Value in this Area
Purchase History
| Date | Buyer | Sale Price | Title Company |
|---|---|---|---|
| Oak Brook Investments Llc | -- | None Available | |
| Thomas L Martone Lt | -- | -- | |
| Martone Thomas L | $100,000 | -- |
Source: Public Records
Mortgage History
| Date | Status | Borrower | Loan Amount |
|---|---|---|---|
| Previous Owner | Martone Thomas L | $90,000 |
Source: Public Records
Tax History Compared to Growth
Tax History
| Year | Tax Paid | Tax Assessment Tax Assessment Total Assessment is a certain percentage of the fair market value that is determined by local assessors to be the total taxable value of land and additions on the property. | Land | Improvement |
|---|---|---|---|---|
| 2024 | $6,407 | $327,200 | $112,600 | $214,600 |
| 2023 | $6,171 | $327,200 | $112,600 | $214,600 |
| 2022 | $5,968 | $327,200 | $112,600 | $214,600 |
| 2021 | $5,785 | $327,200 | $112,600 | $214,600 |
| 2020 | $5,502 | $223,100 | $77,700 | $145,400 |
| 2019 | $5,426 | $223,100 | $77,700 | $145,400 |
| 2018 | $5,223 | $223,100 | $77,700 | $145,400 |
| 2017 | $5,080 | $223,100 | $77,700 | $145,400 |
| 2016 | $5,163 | $223,100 | $77,700 | $145,400 |
| 2015 | $4,918 | $209,800 | $71,200 | $138,600 |
| 2014 | $4,930 | $209,800 | $71,200 | $138,600 |
| 2013 | $4,756 | $209,800 | $71,200 | $138,600 |
Source: Public Records
Map
Nearby Homes