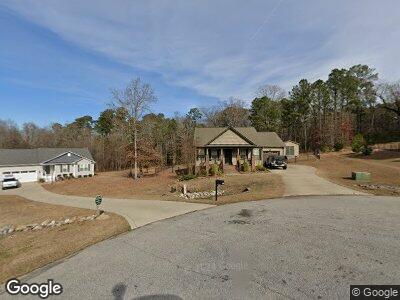
158 Parkers Pointe Dr Unit Lot12 Benson, NC 27504
Elevation NeighborhoodEstimated Value: $299,000 - $307,000
3
Beds
2
Baths
1,285
Sq Ft
$236/Sq Ft
Est. Value
About This Home
This home is located at 158 Parkers Pointe Dr Unit Lot12, Benson, NC 27504 and is currently estimated at $303,380, approximately $236 per square foot. 158 Parkers Pointe Dr Unit Lot12 is a home located in Johnston County with nearby schools including Benson Elementary School, Benson Middle School, and South Johnston High School.
Ownership History
Date
Name
Owned For
Owner Type
Purchase Details
Closed on
Aug 6, 2021
Sold by
Clymore Casey Ryan
Bought by
Sfr Jv 2 Property Llc
Current Estimated Value
Purchase Details
Closed on
Mar 20, 2014
Sold by
Genesis Living Inc
Bought by
Clymore Casey Ryan
Home Financials for this Owner
Home Financials are based on the most recent Mortgage that was taken out on this home.
Original Mortgage
$137,000
Interest Rate
4.5%
Mortgage Type
Adjustable Rate Mortgage/ARM
Purchase Details
Closed on
Nov 26, 2013
Sold by
First Federal Bank
Bought by
Genesis Living Inc
Home Financials for this Owner
Home Financials are based on the most recent Mortgage that was taken out on this home.
Original Mortgage
$102,335
Interest Rate
4.13%
Mortgage Type
Future Advance Clause Open End Mortgage
Create a Home Valuation Report for This Property
The Home Valuation Report is an in-depth analysis detailing your home's value as well as a comparison with similar homes in the area
Home Values in the Area
Average Home Value in this Area
Purchase History
| Date | Buyer | Sale Price | Title Company |
|---|---|---|---|
| Sfr Jv 2 Property Llc | $270,000 | Chicago Title Insurance Co | |
| Clymore Casey Ryan | $137,000 | None Available | |
| Genesis Living Inc | $19,000 | None Available |
Source: Public Records
Mortgage History
| Date | Status | Borrower | Loan Amount |
|---|---|---|---|
| Previous Owner | Clymore Casey Ryan | $155,496 | |
| Previous Owner | Clymore Casey Ryan | $137,000 | |
| Previous Owner | Genesis Living Inc | $102,335 |
Source: Public Records
Tax History Compared to Growth
Tax History
| Year | Tax Paid | Tax Assessment Tax Assessment Total Assessment is a certain percentage of the fair market value that is determined by local assessors to be the total taxable value of land and additions on the property. | Land | Improvement |
|---|---|---|---|---|
| 2024 | $1,340 | $165,430 | $30,000 | $135,430 |
| 2023 | $1,290 | $165,430 | $30,000 | $135,430 |
| 2022 | $1,357 | $165,430 | $30,000 | $135,430 |
| 2021 | $1,269 | $158,650 | $28,500 | $130,150 |
| 2020 | $1,317 | $158,650 | $28,500 | $130,150 |
| 2019 | $1,317 | $158,650 | $28,500 | $130,150 |
| 2018 | $1,232 | $144,980 | $31,350 | $113,630 |
| 2017 | $1,232 | $144,980 | $31,350 | $113,630 |
| 2016 | $1,232 | $144,980 | $31,350 | $113,630 |
| 2015 | $875 | $144,980 | $31,350 | $113,630 |
| 2014 | $875 | $102,970 | $31,350 | $71,620 |
Source: Public Records
Map
Nearby Homes
- 13 Parkers Pointe Dr
- 22 Wynd Crest Way
- 153 Wynd Crest Way
- 171 Wynd Crest Way
- 94 Starry Sky Dr
- 120 Starry Sky Dr
- 8 Pal Ct
- 146 Starry Sky Dr
- 209 Constellation Ct
- 255 Constellation Ct
- 235 Starry Sky Dr
- 279 Constellation Ct
- 321 Constellation Ct
- 262 Starry Sky Dr
- 271 Starry Sky Dr
- 6349 Elevation Rd
- 6383 Elevation Rd
- 165 Dawn Rd
- 69 White Azalea Way Homesite 81
- 33 White Azalea Way Homesite 80
- 158 Parkers Pointe Dr
- 158 Parkers Pointe Dr Unit Lot12
- 152 Parkers Pointe Dr
- 152 Parkers Pointe Dr Unit 11
- 160 Parkers Pointe Dr
- 160 Parkers Pointe Dr Unit 13
- 157 Parkers Pointe Dr
- 157 Parkers Pointe Dr Unit 14
- 140 Parkers Pointe Dr
- 140 Parkers Pointe Dr
- 140 Parkers Pointe Dr Unit 10
- 151 Parkers Pointe Dr
- 151 Parkers Pointe Dr Unit 15
- 126 Parkers Pointe Dr Unit 9
- 126 Parkers Pointe Dr
- 139 Parkers Pointe Dr
- 139 Parkers Pointe Dr Unit 16
- 114 Parkers Pointe Dr Unit 8
- 114 Parkers Pointe Dr Unit LOT19
- 114 Parkers Pointe Dr