Estimated Value: $230,000 - $373,000
Studio
--
Bath
1,472
Sq Ft
$198/Sq Ft
Est. Value
About This Home
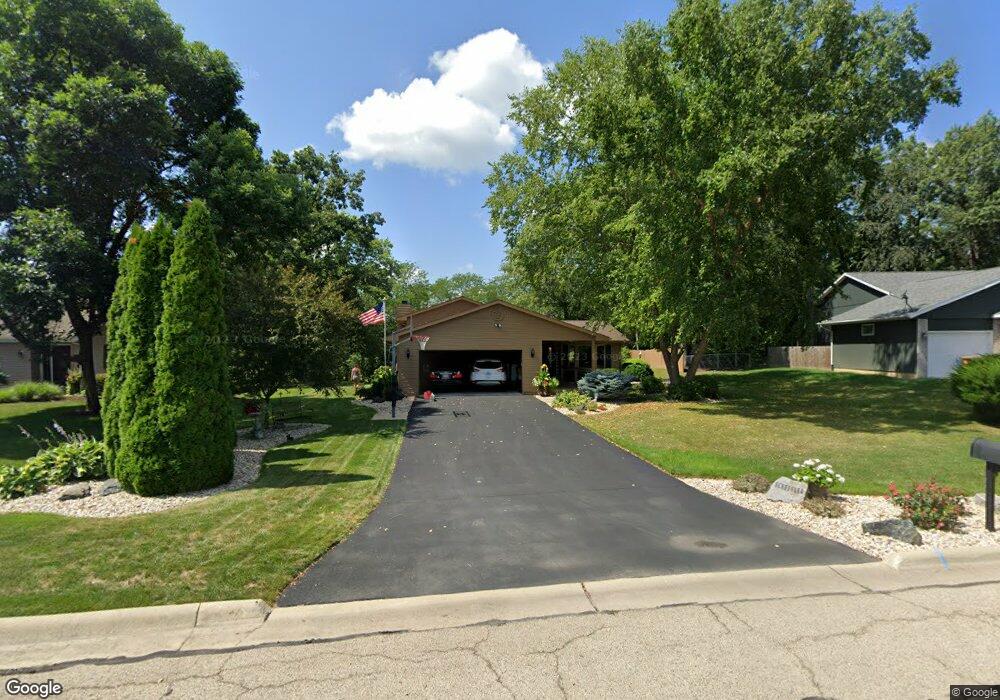
This home is located at 158 S Fox Run Ln, Byron, IL 61010 and is currently estimated at $290,841, approximately $197 per square foot. 158 S Fox Run Ln is a home located in Ogle County with nearby schools including Mary Morgan Elementary School, Byron Middle School, and Byron High School.
Ownership History
Date
Name
Owned For
Owner Type
Purchase Details
Closed on
Aug 18, 2017
Sold by
Scheffler Robert A and Scheffler Jeannine M
Bought by
Scheffler Jeannine M
Current Estimated Value
Purchase Details
Closed on
Aug 1, 2012
Sold by
Sears Michael R and Sears Debra S
Bought by
Scheffler Robert A and Scheffler Jeannine M
Create a Home Valuation Report for This Property
The Home Valuation Report is an in-depth analysis detailing your home's value as well as a comparison with similar homes in the area
Home Values in the Area
Average Home Value in this Area
Purchase History
| Date | Buyer | Sale Price | Title Company |
|---|---|---|---|
| Scheffler Jeannine M | -- | -- | |
| Scheffler Robert A | $179,900 | None Available |
Source: Public Records
Tax History
| Year | Tax Paid | Tax Assessment Tax Assessment Total Assessment is a certain percentage of the fair market value that is determined by local assessors to be the total taxable value of land and additions on the property. | Land | Improvement |
|---|---|---|---|---|
| 2024 | $5,841 | $74,355 | $16,365 | $57,990 |
| 2023 | $5,454 | $70,687 | $15,558 | $55,129 |
| 2022 | $5,107 | $65,554 | $14,428 | $51,126 |
| 2021 | $5,012 | $62,755 | $13,812 | $48,943 |
| 2020 | $4,613 | $61,524 | $13,541 | $47,983 |
| 2019 | $4,613 | $59,588 | $13,115 | $46,473 |
| 2018 | $4,601 | $58,049 | $12,776 | $45,273 |
| 2017 | $4,553 | $58,049 | $12,776 | $45,273 |
| 2016 | $4,272 | $56,983 | $12,541 | $44,442 |
| 2015 | $4,053 | $55,162 | $12,140 | $43,022 |
| 2014 | $4,007 | $55,162 | $12,140 | $43,022 |
| 2013 | $4,145 | $55,871 | $12,296 | $43,575 |
Source: Public Records
Map
Nearby Homes
- 265 Creekside Dr
- 932 W 2nd St
- 7424 N River Rd
- 820 Crest View Trail
- 8890 Hales Corner Rd Rd
- 1903 Silverthorn Dr
- 509 N Walnut St
- 1245 Glacier Dr
- 1257 Glacier Dr
- 8668 Yosemite Dr
- 1368 Joanne Terrace
- 617 E 3rd St
- 1574 Warrenton Dr
- 713 Birch St
- 2917 Everett Ln
- 00 E Ashelford Dr Unit LOT 8
- 00 E Ashelford Dr
- 5115 Hamlet Cir
- 8894 Illinois 2
- 5206 E Hubbard Trail
- 162 S Fox Run Ln
- 166 S Fox Run Ln
- 150 S Fox Run Ln
- 153 S Fox Run Ln
- 157 S Fox Run Ln
- 149 S Fox Run Ln
- 161 S Fox Run Ln
- 146 S Fox Run Ln
- 170 S Fox Run Ln
- 145 S Fox Run Ln
- 165 S Fox Run Ln
- 158 Deerwood Ct
- 142 S Fox Run Ln
- 139 S Fox Run Ln
- 174 S Fox Run Ln
- 154 Deerwood Ct
- 169 S Fox Run Ln
- 135 S Fox Run Ln
- 176 S Fox Run Ln
- 138 S Fox Run Ln
Your Personal Tour Guide
Ask me questions while you tour the home.