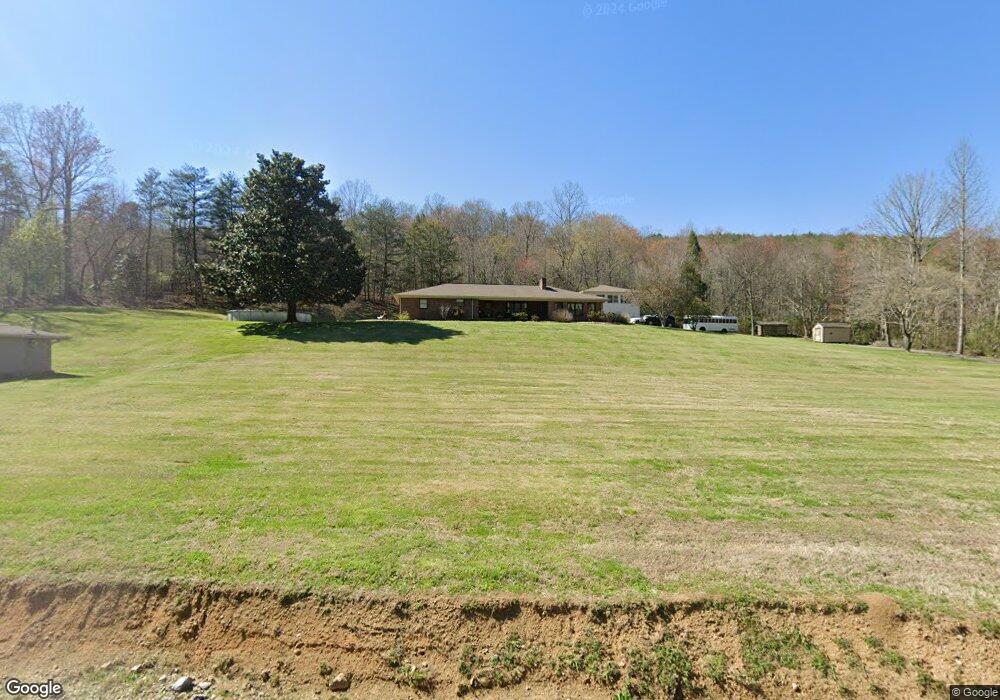
158 Unicoi Church Rd Tellico Plains, TN 37385
Estimated Value: $419,000 - $641,000
3
Beds
3
Baths
2,570
Sq Ft
$209/Sq Ft
Est. Value
About This Home
This home is located at 158 Unicoi Church Rd, Tellico Plains, TN 37385 and is currently estimated at $537,166, approximately $209 per square foot. 158 Unicoi Church Rd is a home located in Monroe County with nearby schools including Tellico Plains Elementary School, Tellico Plains Junior High School, and Tellico Plains High School.
Ownership History
Date
Name
Owned For
Owner Type
Purchase Details
Closed on
Jan 4, 2022
Sold by
Hooper Mobley Carrie
Bought by
Mobley Carrie Hooper and Hooper Janet
Current Estimated Value
Home Financials for this Owner
Home Financials are based on the most recent Mortgage that was taken out on this home.
Original Mortgage
$238,095
Outstanding Balance
$220,245
Interest Rate
3.55%
Mortgage Type
FHA
Estimated Equity
$316,921
Purchase Details
Closed on
Jun 9, 2011
Sold by
Mobley Mark
Bought by
Mobley Carrie Hooper
Purchase Details
Closed on
Sep 11, 2001
Sold by
James Sylvester
Bought by
Carrie Mobley
Purchase Details
Closed on
Aug 18, 1997
Sold by
Sylvester James Arnold E
Bought by
Janey Hooper
Purchase Details
Closed on
Jul 25, 1966
Bought by
Sylvester Lucille
Create a Home Valuation Report for This Property
The Home Valuation Report is an in-depth analysis detailing your home's value as well as a comparison with similar homes in the area
Home Values in the Area
Average Home Value in this Area
Purchase History
| Date | Buyer | Sale Price | Title Company |
|---|---|---|---|
| Mobley Carrie Hooper | -- | Windsor John O | |
| Mobley Carrie Hooper | -- | None Listed On Document | |
| Mobley Carrie Hooper | -- | -- | |
| Carrie Mobley | $90,000 | -- | |
| Janey Hooper | $30,000 | -- | |
| James Sylvester | $9,000 | -- | |
| Sylvester Lucille | -- | -- |
Source: Public Records
Mortgage History
| Date | Status | Borrower | Loan Amount |
|---|---|---|---|
| Open | Mobley Carrie Hooper | $238,095 | |
| Closed | Mobley Carrie Hooper | $238,095 |
Source: Public Records
Tax History Compared to Growth
Tax History
| Year | Tax Paid | Tax Assessment Tax Assessment Total Assessment is a certain percentage of the fair market value that is determined by local assessors to be the total taxable value of land and additions on the property. | Land | Improvement |
|---|---|---|---|---|
| 2025 | $1,890 | $124,100 | $0 | $0 |
| 2024 | $1,890 | $124,100 | $6,825 | $117,275 |
| 2023 | $1,880 | $123,450 | $6,825 | $116,625 |
| 2022 | $1,675 | $74,775 | $4,850 | $69,925 |
| 2021 | $1,675 | $74,775 | $4,850 | $69,925 |
| 2020 | $1,675 | $74,775 | $4,850 | $69,925 |
| 2019 | $1,480 | $74,775 | $4,850 | $69,925 |
| 2018 | $1,049 | $53,000 | $4,850 | $48,150 |
| 2017 | $958 | $45,750 | $3,600 | $42,150 |
| 2016 | $958 | $45,750 | $3,600 | $42,150 |
| 2015 | $958 | $45,750 | $3,600 | $42,150 |
| 2014 | $958 | $45,754 | $0 | $0 |
Source: Public Records
Map
Nearby Homes
- 0 Unicoi Church Rd
- 135 H & H Rd
- 0 Highway 68 Unit 1316530
- 0 Highway 68 Unit 24267548
- 0 Highway 68 Unit 1316540
- 410 Scott St
- 125 Indian Ridge Dr
- 217 Loomis St
- 207 Loomis St
- 434 Unicoi Church Rd
- 111 Bryan Hill Dr
- 903 Veterans Memorial Dr
- 390 Cherohala Skyway
- 104 Hereford St
- 115 Willowbrook Dr
- 156 Croft Rd
- 2 Cherohala Skyway
- Trc. 1 Mecca Pike
- Tract 2 Mecca Pike
- 115 Martin Rd
- 165 Unicoi Church Rd
- 153 Unicoi Church Rd
- 0 Unicoi Church Ln
- 9438 New Highway 68
- 9436 New Highway 68
- 9436 New Hwy Unit 68
- LOT 3 Unicoi Church Rd
- LOT 2 Unicoi Church Rd
- LOT 1 Unicoi Church Rd
- Tract 2 Unicoi Church Rd
- Tract 4 Unicoi Church Rd
- Tract 3 Unicoi Church Rd
- Tract 1 Unicoi Church Rd
- 1 Unicoi Church Ln
- 0 Tract 2 Unicoi Church Rd Unit 1170311
- 0 Tract 4 Unicoi Church Rd Unit 1170315
- 0 Tract 3 Unicoi Church Rd Unit 1170314
- 192 Unicoi Church Rd
- 192 Unicoi Church Rd
- 192 Unicoi Church Rd