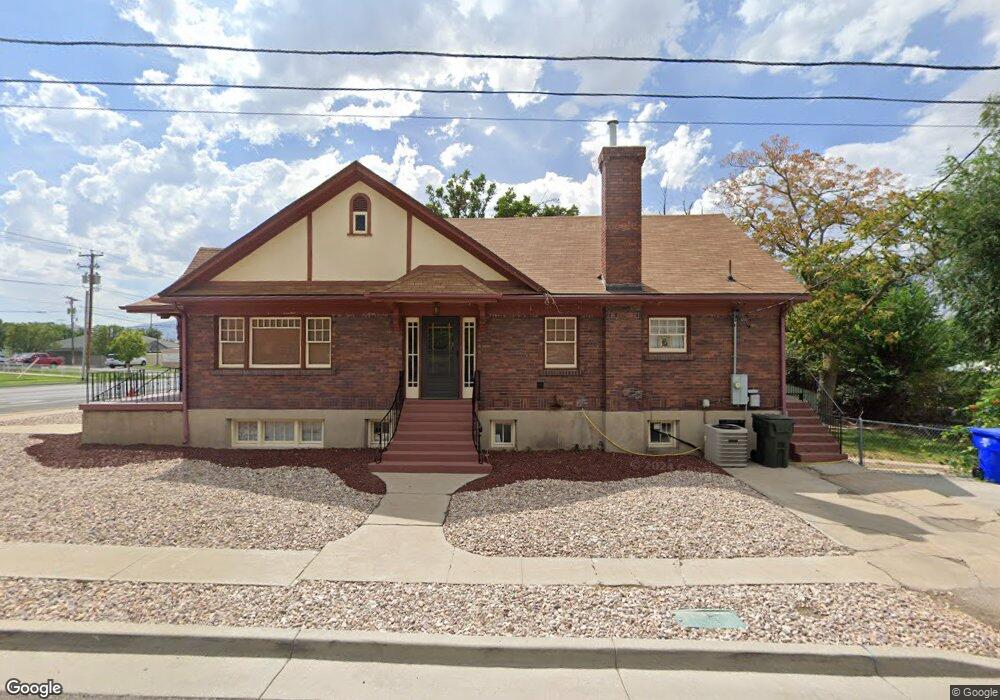
158 W Vine St Tooele, UT 84074
Estimated Value: $369,000 - $421,000
4
Beds
2
Baths
3,102
Sq Ft
$128/Sq Ft
Est. Value
About This Home
This home is located at 158 W Vine St, Tooele, UT 84074 and is currently estimated at $398,119, approximately $128 per square foot. 158 W Vine St is a home located in Tooele County with nearby schools including Northlake Elementary School, Tooele Junior High School, and Tooele High School.
Ownership History
Date
Name
Owned For
Owner Type
Purchase Details
Closed on
May 21, 2018
Sold by
Robbins Greg G
Bought by
Robbins Greg G and Robbins Mary Lyn
Current Estimated Value
Home Financials for this Owner
Home Financials are based on the most recent Mortgage that was taken out on this home.
Original Mortgage
$145,000
Outstanding Balance
$124,850
Interest Rate
4.4%
Mortgage Type
New Conventional
Estimated Equity
$273,269
Purchase Details
Closed on
Feb 20, 2014
Sold by
U S Bank Trust N A
Bought by
Robbins Greg G and Robbins Mary Lyn
Home Financials for this Owner
Home Financials are based on the most recent Mortgage that was taken out on this home.
Original Mortgage
$105,000
Interest Rate
4.47%
Mortgage Type
New Conventional
Purchase Details
Closed on
Oct 17, 2013
Sold by
Kallas Karen and Kallas Steve
Bought by
Us Bank Trust Na
Create a Home Valuation Report for This Property
The Home Valuation Report is an in-depth analysis detailing your home's value as well as a comparison with similar homes in the area
Home Values in the Area
Average Home Value in this Area
Purchase History
| Date | Buyer | Sale Price | Title Company |
|---|---|---|---|
| Robbins Greg G | -- | Old Republic Title | |
| Robbins Greg G | -- | Old Republic Title | |
| Robbins Greg G | -- | Inwest Title | |
| Us Bank Trust Na | $119,000 | Etitle Insurance Agency |
Source: Public Records
Mortgage History
| Date | Status | Borrower | Loan Amount |
|---|---|---|---|
| Open | Robbins Greg G | $145,000 | |
| Closed | Robbins Greg G | $145,000 | |
| Closed | Robbins Greg G | $105,000 |
Source: Public Records
Tax History Compared to Growth
Tax History
| Year | Tax Paid | Tax Assessment Tax Assessment Total Assessment is a certain percentage of the fair market value that is determined by local assessors to be the total taxable value of land and additions on the property. | Land | Improvement |
|---|---|---|---|---|
| 2025 | $2,701 | $225,267 | $36,608 | $188,659 |
| 2024 | $2,898 | $221,231 | $36,608 | $184,623 |
| 2023 | $2,898 | $184,206 | $35,646 | $148,560 |
| 2022 | $2,653 | $228,236 | $43,824 | $184,412 |
| 2021 | $2,304 | $165,818 | $29,216 | $136,602 |
| 2020 | $2,232 | $278,567 | $30,200 | $248,367 |
| 2019 | $2,005 | $246,171 | $30,200 | $215,971 |
| 2018 | $1,957 | $227,801 | $40,000 | $187,801 |
| 2017 | $1,590 | $219,699 | $31,250 | $188,449 |
| 2016 | $1,299 | $107,315 | $17,188 | $90,127 |
| 2015 | $1,299 | $94,498 | $0 | $0 |
| 2014 | -- | $94,498 | $0 | $0 |
Source: Public Records
Map
Nearby Homes