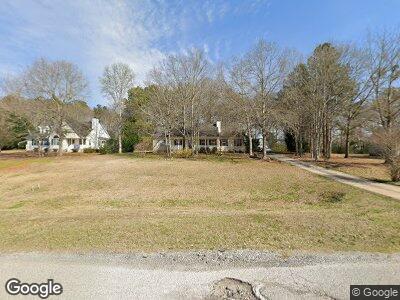
158 Wilder Way Williamson, GA 30292
Spalding County NeighborhoodEstimated Value: $267,000 - $294,000
3
Beds
2
Baths
1,768
Sq Ft
$157/Sq Ft
Est. Value
About This Home
This home is located at 158 Wilder Way, Williamson, GA 30292 and is currently estimated at $277,036, approximately $156 per square foot. 158 Wilder Way is a home located in Spalding County with nearby schools including Moreland Road Elementary School, Carver Road Middle School, and Griffin High School.
Ownership History
Date
Name
Owned For
Owner Type
Purchase Details
Closed on
Jun 26, 2003
Sold by
Ross Wilbur J and Ross Mary B
Bought by
Akin Teri A
Current Estimated Value
Home Financials for this Owner
Home Financials are based on the most recent Mortgage that was taken out on this home.
Original Mortgage
$119,059
Interest Rate
5.3%
Mortgage Type
FHA
Purchase Details
Closed on
Jan 12, 2001
Sold by
Ross Wilbur J
Bought by
Ross Wilbur J and Ross Mary B
Home Financials for this Owner
Home Financials are based on the most recent Mortgage that was taken out on this home.
Original Mortgage
$92,480
Interest Rate
10.7%
Mortgage Type
New Conventional
Purchase Details
Closed on
Jan 9, 2001
Sold by
Griffin Remodeling Inc
Bought by
Ross Wilbur J
Home Financials for this Owner
Home Financials are based on the most recent Mortgage that was taken out on this home.
Original Mortgage
$92,480
Interest Rate
10.7%
Mortgage Type
New Conventional
Create a Home Valuation Report for This Property
The Home Valuation Report is an in-depth analysis detailing your home's value as well as a comparison with similar homes in the area
Home Values in the Area
Average Home Value in this Area
Purchase History
| Date | Buyer | Sale Price | Title Company |
|---|---|---|---|
| Akin Teri A | $120,000 | -- | |
| Ross Wilbur J | -- | -- | |
| Ross Wilbur J | $115,600 | -- |
Source: Public Records
Mortgage History
| Date | Status | Borrower | Loan Amount |
|---|---|---|---|
| Open | Akin Teri | $119,700 | |
| Closed | Akin Teri | $15,000 | |
| Closed | Akin Teri A | $119,059 | |
| Previous Owner | Ross Wilbur J | $107,115 | |
| Previous Owner | Ross Wilbur J | $92,480 | |
| Previous Owner | Ross Wilbur J | $11,500 |
Source: Public Records
Tax History Compared to Growth
Tax History
| Year | Tax Paid | Tax Assessment Tax Assessment Total Assessment is a certain percentage of the fair market value that is determined by local assessors to be the total taxable value of land and additions on the property. | Land | Improvement |
|---|---|---|---|---|
| 2024 | $3,226 | $90,964 | $10,000 | $80,964 |
| 2023 | $3,226 | $85,448 | $10,000 | $75,448 |
| 2022 | $2,508 | $69,780 | $8,000 | $61,780 |
| 2021 | $2,015 | $56,232 | $4,000 | $52,232 |
| 2020 | $1,685 | $46,990 | $4,000 | $42,990 |
| 2019 | $1,580 | $43,281 | $4,000 | $39,281 |
| 2018 | $1,495 | $39,993 | $4,000 | $35,993 |
| 2017 | $1,456 | $39,993 | $4,000 | $35,993 |
| 2016 | $1,096 | $29,812 | $4,000 | $25,812 |
| 2015 | $1,379 | $36,236 | $8,000 | $28,236 |
| 2014 | $1,406 | $36,236 | $8,000 | $28,236 |
Source: Public Records
Map
Nearby Homes
- 0 Maloy Rd Unit 7407276
- 0 Maloy Rd Unit 10322485
- 1495 Rover Zetella Rd
- 129 Bethany Rd
- 502 N Rover Rd
- 419 Rawls Rd
- 203 Seminary Ridge
- 11 West Rd
- 571 Lakeside Rd
- 1762 Cheryl Ave
- 1724 Mary Ave
- 211 Lake Chase Dr N
- 733 S Pine Hill Rd
- 392 I B Howard Rd
- 140 Shoal Creek Rd
- 711 S Pine Hill Rd
- 113 Lake Chase Dr S
- 3855 Newnan Rd
- 1818 Carrington Dr Unit 1818
- 1745 Carrington Dr
- 158 Wilder Way
- 160 Wilder Way
- 156 Wilder Way
- 162 Wilder Way
- 154 Wilder Way
- 164 Wilder Way
- 149 Wilder Way
- 151 Wilder Way
- 153 Wilder Way
- 152 Wilder Way
- 155 Wilder Way
- 166 Wilder Way
- 147 Wilder Way
- 157 Wilder Way
- 168 Wilder Way
- 170 Wilder Way Unit 3
- 170 Wilder Way
- 150 Wilder Way
- 159 Wilder Way
- 161 Wilder Way