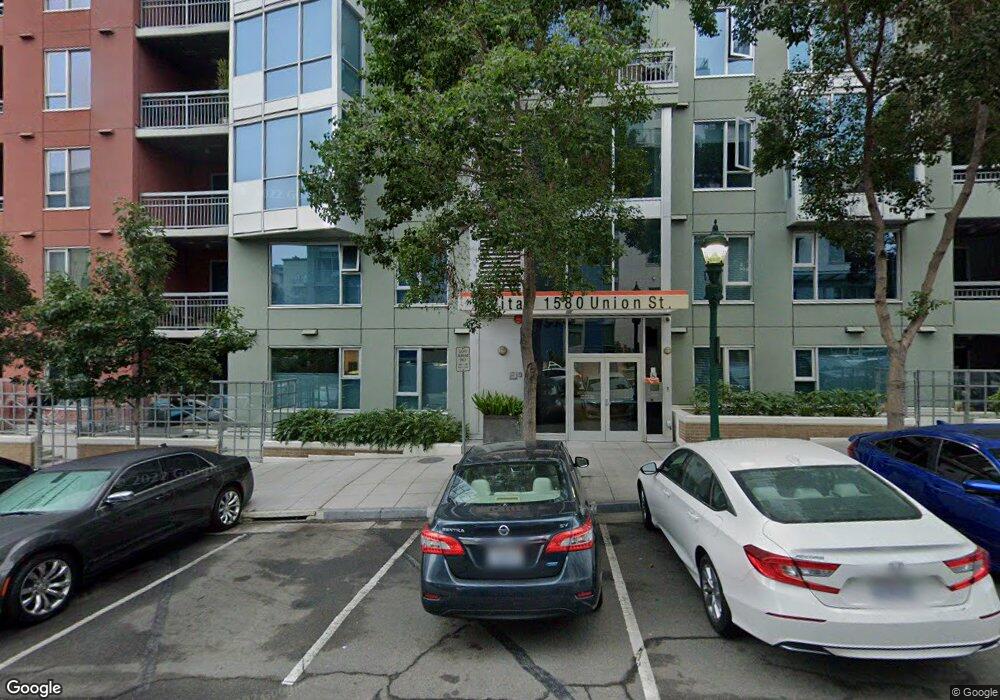
La Vita 1580 Union St Unit 304 San Diego, CA 92101
Little Italy NeighborhoodEstimated Value: $536,589 - $706,000
1
Bed
1
Bath
681
Sq Ft
$861/Sq Ft
Est. Value
About This Home
This home is located at 1580 Union St Unit 304, San Diego, CA 92101 and is currently estimated at $586,397, approximately $861 per square foot. 1580 Union St Unit 304 is a home located in San Diego County with nearby schools including Washington Elementary School, Roosevelt International Middle School, and Museum School.
Ownership History
Date
Name
Owned For
Owner Type
Purchase Details
Closed on
Dec 24, 2020
Sold by
Silatech Inc 401K Plan
Bought by
Equity Trust Company
Current Estimated Value
Purchase Details
Closed on
Apr 24, 2014
Sold by
Zonis Julio and Zonis Perla
Bought by
Silatech Inc 401K Plan
Purchase Details
Closed on
Nov 19, 2010
Sold by
Sd Coastline Lp
Bought by
Zonis Julio and Zonis Perla
Purchase Details
Closed on
May 24, 2010
Sold by
Juckett Jennifer L
Bought by
Sd Coastline Lp
Purchase Details
Closed on
Mar 11, 2005
Sold by
Adrian Maril and Beane Jeffrey C
Bought by
Juckett Jennifer L
Home Financials for this Owner
Home Financials are based on the most recent Mortgage that was taken out on this home.
Original Mortgage
$328,000
Interest Rate
5.5%
Mortgage Type
Purchase Money Mortgage
Create a Home Valuation Report for This Property
The Home Valuation Report is an in-depth analysis detailing your home's value as well as a comparison with similar homes in the area
Home Values in the Area
Average Home Value in this Area
Purchase History
| Date | Buyer | Sale Price | Title Company |
|---|---|---|---|
| Equity Trust Company | -- | None Available | |
| Silatech Inc 401K Plan | $377,000 | Chicago Title Company | |
| Zonis Julio | $235,000 | Stewart Title Of Ca Inc | |
| Sd Coastline Lp | $220,500 | Accommodation | |
| Juckett Jennifer L | $415,000 | California Title Company | |
| Adrian Maril | -- | California Title Company |
Source: Public Records
Mortgage History
| Date | Status | Borrower | Loan Amount |
|---|---|---|---|
| Previous Owner | Juckett Jennifer L | $328,000 | |
| Closed | Juckett Jennifer L | $82,000 |
Source: Public Records
Tax History Compared to Growth
Tax History
| Year | Tax Paid | Tax Assessment Tax Assessment Total Assessment is a certain percentage of the fair market value that is determined by local assessors to be the total taxable value of land and additions on the property. | Land | Improvement |
|---|---|---|---|---|
| 2025 | $5,987 | $462,139 | $122,581 | $339,558 |
| 2024 | $5,987 | $453,078 | $120,178 | $332,900 |
| 2023 | $5,845 | $444,195 | $117,822 | $326,373 |
| 2022 | $5,682 | $435,486 | $115,512 | $319,974 |
| 2021 | $5,629 | $426,948 | $113,248 | $313,700 |
| 2020 | $5,565 | $422,571 | $112,087 | $310,484 |
| 2019 | $5,456 | $414,287 | $109,890 | $304,397 |
| 2018 | $5,107 | $406,165 | $107,736 | $298,429 |
| 2017 | $4,979 | $398,202 | $105,624 | $292,578 |
| 2016 | $4,890 | $390,395 | $103,553 | $286,842 |
| 2015 | $4,809 | $384,532 | $101,998 | $282,534 |
| 2014 | $3,176 | $245,603 | $62,707 | $182,896 |
Source: Public Records
About La Vita
Map
Nearby Homes
- 425 W Beech St Unit 1706
- 425 W Beech St Unit 1003
- 425 W Beech St Unit 1504
- 425 W Beech St Unit 223
- 425 W Beech St Unit 1205
- 425 W Beech St Unit 722
- 1494 Union St Unit 403
- 350 W Ash St Unit 1207
- 1545 State St Unit TH2
- 300 W Beech St Unit 1101
- 300 W Beech St Unit 1909
- 1501 India St Unit 605
- 1501 India St Unit 608
- 1435 India St Unit 409
- 1620 Union St Unit 1
- 1501 Front St Unit 338
- 1601 India St Unit 307
- 1601 India St Unit 207
- 1601 India St Unit 105
- 1601 India St Unit 116
- 1580 Union St Unit La Vita
- 300 W Beech #2105 St
- 1580 Union Steet 406
- 1580 Union St Unit 106
- 1580 Union St Unit 104
- 1580 Union St Unit 107
- 1580 Union St Unit 103
- 1580 Union St Unit 108
- 1580 Union St Unit 310
- 1580 Union St Unit 309
- 1580 Union St Unit 308
- 1580 Union St Unit 307
- 1580 Union St Unit 306
- 1580 Union St Unit 305
- 1580 Union St Unit 303
- 1580 Union St Unit 302
- 1580 Union St Unit 301
- 1580 Union St Unit 3
- 1580 Union St Unit 2
- 1580 Union St Unit 1