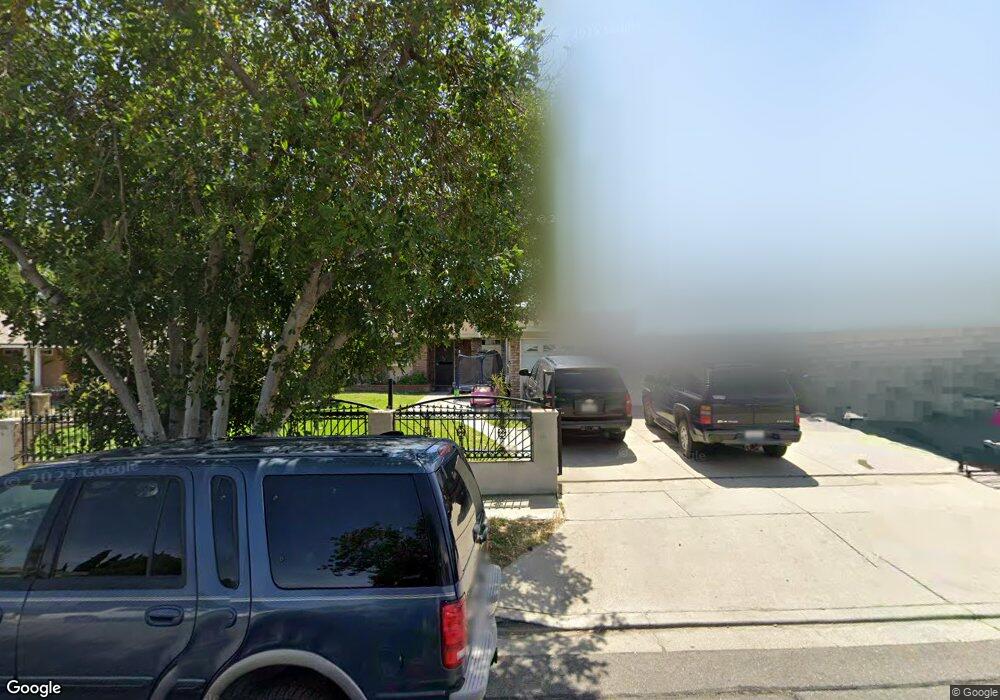
15801 Redbud Ct Fontana, CA 92335
Estimated Value: $595,000 - $640,000
4
Beds
2
Baths
1,430
Sq Ft
$429/Sq Ft
Est. Value
About This Home
This home is located at 15801 Redbud Ct, Fontana, CA 92335 and is currently estimated at $613,647, approximately $429 per square foot. 15801 Redbud Ct is a home located in San Bernardino County with nearby schools including Citrus Elementary School, Sequoia Middle School, and Fontana High School.
Ownership History
Date
Name
Owned For
Owner Type
Purchase Details
Closed on
Oct 30, 2020
Sold by
Dejesus Valencia Omero
Bought by
Campos Leslie Ramirez
Current Estimated Value
Purchase Details
Closed on
Apr 25, 2013
Sold by
Pavon Maria S
Bought by
Ramirez Maria S
Purchase Details
Closed on
Feb 24, 2012
Sold by
Pavon Maria S
Bought by
Pavon Maria S and Pavon Jose R
Purchase Details
Closed on
Jun 2, 2009
Sold by
New Revelations Equity & Investments Llc
Bought by
Campos Pedro and Campos Maria
Purchase Details
Closed on
Feb 22, 2009
Sold by
Campos Pedro
Bought by
New Revelations Equity & Investments Llc
Purchase Details
Closed on
Apr 18, 2001
Sold by
Flores Osvaldo G
Bought by
Campos Pedro L and Campos Maria S
Home Financials for this Owner
Home Financials are based on the most recent Mortgage that was taken out on this home.
Original Mortgage
$139,806
Interest Rate
7.06%
Mortgage Type
FHA
Create a Home Valuation Report for This Property
The Home Valuation Report is an in-depth analysis detailing your home's value as well as a comparison with similar homes in the area
Home Values in the Area
Average Home Value in this Area
Purchase History
| Date | Buyer | Sale Price | Title Company |
|---|---|---|---|
| Campos Leslie Ramirez | -- | None Available | |
| Campos Leslie Ramirez | -- | None Available | |
| Ramirez Maria S | -- | None Available | |
| Pavon Maria S | -- | None Available | |
| Campos Pedro | -- | None Available | |
| New Revelations Equity & Investments Llc | -- | None Available | |
| Campos Pedro L | $144,500 | Orange Coast Title |
Source: Public Records
Mortgage History
| Date | Status | Borrower | Loan Amount |
|---|---|---|---|
| Previous Owner | Campos Pedro L | $139,806 | |
| Closed | Campos Pedro L | $4,260 |
Source: Public Records
Tax History Compared to Growth
Tax History
| Year | Tax Paid | Tax Assessment Tax Assessment Total Assessment is a certain percentage of the fair market value that is determined by local assessors to be the total taxable value of land and additions on the property. | Land | Improvement |
|---|---|---|---|---|
| 2025 | $3,111 | $212,485 | $70,830 | $141,655 |
| 2024 | $3,111 | $208,318 | $69,441 | $138,877 |
| 2023 | $2,487 | $204,233 | $68,079 | $136,154 |
| 2022 | $5,074 | $438,600 | $132,600 | $306,000 |
| 2021 | $2,527 | $198,900 | $63,362 | $135,538 |
| 2020 | $2,507 | $196,860 | $62,712 | $134,148 |
| 2019 | $2,442 | $193,000 | $61,482 | $131,518 |
| 2018 | $2,456 | $189,215 | $60,276 | $128,939 |
| 2017 | $2,418 | $185,505 | $59,094 | $126,411 |
| 2016 | $2,357 | $181,867 | $57,935 | $123,932 |
| 2015 | $2,311 | $179,135 | $57,065 | $122,070 |
| 2014 | $2,299 | $175,626 | $55,947 | $119,679 |
Source: Public Records
Map
Nearby Homes
- 9408 Poplar Ave
- 15867 Randall Ave
- 15937 Manzanita Dr
- 15994 Sequoia Ave
- 15589 Randall Ave
- 9250 Citrus Ave Unit E
- 16139 Dianthus Ave
- 9833 Niagara Ave
- 9167 Citrus Ave
- 9756 Elm Ave
- 15413 Pine Ave
- 15317 Athol St
- 9963 Eugenia Ave
- 9153 Beech Ave
- 16265 Pine Ave
- 9310 Carob St
- 16171 Winterwood Ln
- 9059 Beech Ave
- 8936 Summerwood Way
- 9652 Date St
- 15811 Redbud Ct
- 15791 Redbud Ct
- 15800 Del Rey Ct
- 15790 Del Rey Ct
- 15810 Del Rey Ct
- 15821 Redbud Ct
- 15781 Redbud Ct
- 15800 Redbud Ct
- 15810 Redbud Ct
- 15820 Del Rey Ct
- 15790 Redbud Ct
- 15780 Del Rey Ct
- 15820 Redbud Ct
- 15780 Redbud Ct
- 15801 Del Rey Ct
- 15801 Hawthorne Ave
- 15791 Hawthorne Ave
- 15811 Del Rey Ct
- 15811 Hawthorne Ave
- 15791 Del Rey Ct