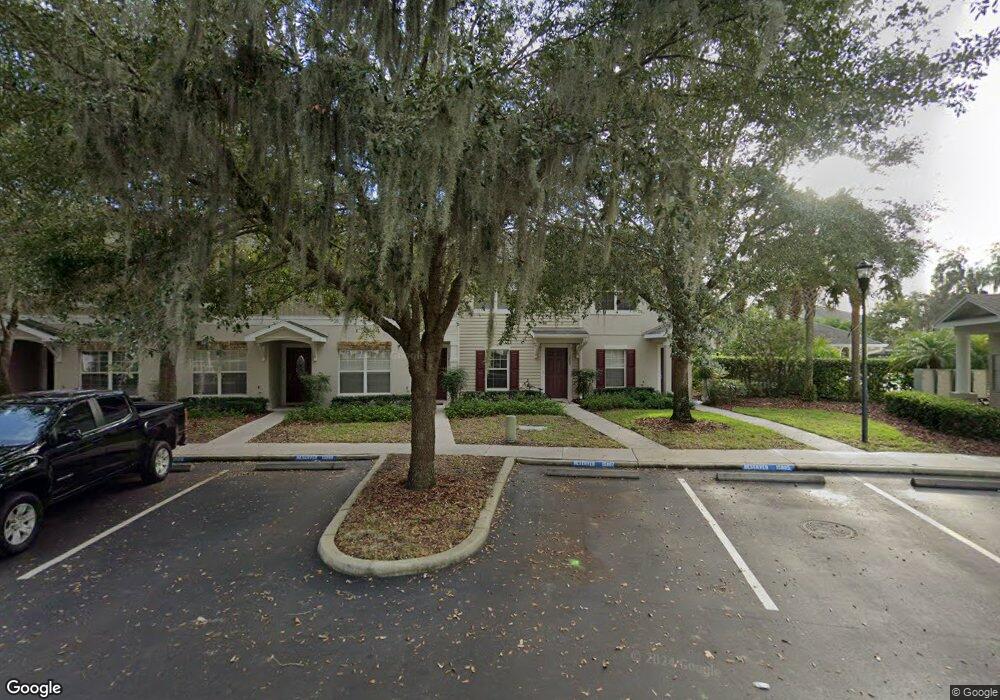
15807 Fishhawk Falls Dr Unit 15807 Lithia, FL 33547
FishHawk Ranch NeighborhoodEstimated Value: $232,309 - $248,000
2
Beds
3
Baths
1,374
Sq Ft
$176/Sq Ft
Est. Value
About This Home
This home is located at 15807 Fishhawk Falls Dr Unit 15807, Lithia, FL 33547 and is currently estimated at $241,327, approximately $175 per square foot. 15807 Fishhawk Falls Dr Unit 15807 is a home located in Hillsborough County with nearby schools including Bevis Elementary School, Ojus Elementary School, and North Haven Middle School.
Ownership History
Date
Name
Owned For
Owner Type
Purchase Details
Closed on
Aug 31, 2021
Sold by
Sanchez Farren Magda A
Bought by
Arora Anshul and Sethi Anjali
Current Estimated Value
Home Financials for this Owner
Home Financials are based on the most recent Mortgage that was taken out on this home.
Original Mortgage
$157,500
Outstanding Balance
$143,099
Interest Rate
2.7%
Mortgage Type
New Conventional
Estimated Equity
$98,228
Purchase Details
Closed on
Jan 25, 2008
Sold by
Standard Pacific Of Tampa
Bought by
Sanchez Farren Magda A
Home Financials for this Owner
Home Financials are based on the most recent Mortgage that was taken out on this home.
Original Mortgage
$89,550
Interest Rate
6.12%
Mortgage Type
Purchase Money Mortgage
Purchase Details
Closed on
Jun 7, 2006
Sold by
Fishhawk Communities Lp
Bought by
Standard Pacific Of Tampa
Create a Home Valuation Report for This Property
The Home Valuation Report is an in-depth analysis detailing your home's value as well as a comparison with similar homes in the area
Home Values in the Area
Average Home Value in this Area
Purchase History
| Date | Buyer | Sale Price | Title Company |
|---|---|---|---|
| Arora Anshul | $210,000 | Fidelity Natl Ttl Of Fl Inc | |
| Sanchez Farren Magda A | $99,500 | Alday Donalson Title Agencie | |
| Standard Pacific Of Tampa | $777,600 | Fuentes & Kreischer Title Co |
Source: Public Records
Mortgage History
| Date | Status | Borrower | Loan Amount |
|---|---|---|---|
| Open | Arora Anshul | $157,500 | |
| Previous Owner | Sanchez Farren Magda A | $89,550 |
Source: Public Records
Tax History Compared to Growth
Tax History
| Year | Tax Paid | Tax Assessment Tax Assessment Total Assessment is a certain percentage of the fair market value that is determined by local assessors to be the total taxable value of land and additions on the property. | Land | Improvement |
|---|---|---|---|---|
| 2024 | $5,101 | $207,316 | $20,657 | $186,659 |
| 2023 | $4,870 | $193,377 | $19,272 | $174,105 |
| 2022 | $4,589 | $176,159 | $17,549 | $158,610 |
| 2021 | $3,641 | $133,750 | $13,319 | $120,431 |
| 2020 | $3,560 | $123,624 | $12,306 | $111,318 |
| 2019 | $3,417 | $117,660 | $11,715 | $105,945 |
| 2018 | $3,287 | $111,583 | $0 | $0 |
| 2017 | $3,097 | $95,914 | $0 | $0 |
| 2016 | $3,034 | $80,122 | $0 | $0 |
| 2015 | $2,933 | $72,838 | $0 | $0 |
| 2014 | $2,735 | $66,216 | $0 | $0 |
| 2013 | -- | $60,196 | $0 | $0 |
Source: Public Records
Map
Nearby Homes
- 15848 Fishhawk Falls Dr
- 15942 Fishhawk View Dr
- 15909 Fishhawk View Dr
- 5717 Fishhawk Ridge Dr
- 15843 Fishhawk View Dr
- 15733 Fishhawk Falls Dr
- 5860 Fishhawk Ridge Dr
- 16022 Ternglade Dr
- 5406 Fishhawk Ridge Dr
- 15607 Sunset Run Ln
- 15629 Starling Water Dr
- 5331 Sagecrest Dr
- 16220 Ternglade Dr
- 5909 Grand Loneoak Ln
- 16226 Bayberry View Dr
- 5601 Tanagergrove Way
- 5918 Beaconpark St
- 16007 Loneoak View Dr
- 16001 Loneoak View Dr
- 5950 Beaconpark St
- 15807 Fishhawk Falls Dr
- 15805 Fishhawk Falls Dr
- 15809 Fishhawk Falls Dr
- 15815 Fishhawk Falls Dr
- 15815 Fishhawk Falls Dr Unit 15815
- 15817 Fishhawk Falls Dr
- 5702 Fishhawk Ridge Dr
- 15819 Fishhawk Falls Dr
- 5710 Fishhawk Ridge Dr
- 15825 Fishhawk Falls Dr
- 15827 Fishhawk Falls Dr
- 5714 Fishhawk Ridge Dr
- 15829 Fishhawk Falls Dr
- 5716 Fishhawk Ridge Dr
- 15831 Fishhawk Falls Dr
- 15831 Fishhawk Falls Dr
- 5718 Fishhawk Ridge Dr
- 15833 Fishhawk Falls Dr
- 15835 Fishhawk Falls Dr
- 15810 Fishhawk Falls Dr