1581 180th St Sioux City, IA 51106
Estimated Value: $217,000 - $485,000
4
Beds
2
Baths
1,686
Sq Ft
$201/Sq Ft
Est. Value
About This Home
This home is located at 1581 180th St, Sioux City, IA 51106 and is currently estimated at $338,056, approximately $200 per square foot. 1581 180th St is a home with nearby schools including Sergeant Bluff-Luton Primary School, Sergeant Bluff-Luton Elementary School, and Sergeant Bluff-Luton Middle School.
Ownership History
Date
Name
Owned For
Owner Type
Purchase Details
Closed on
Feb 5, 2024
Sold by
Squier J Mark J and Squier Althea K
Bought by
J Mark Squier And Althea Squier Trust
Current Estimated Value
Purchase Details
Closed on
Aug 23, 2006
Sold by
Lobaugh Brandon and Lobaugh Cassiday
Bought by
Squier J Mark and Squier Althea K
Home Financials for this Owner
Home Financials are based on the most recent Mortgage that was taken out on this home.
Original Mortgage
$117,560
Interest Rate
6.77%
Mortgage Type
New Conventional
Purchase Details
Closed on
Nov 15, 2005
Sold by
Cole Kathy and Cole Albert
Bought by
Lobaugh Brandon and Lobaugh Cassidy
Home Financials for this Owner
Home Financials are based on the most recent Mortgage that was taken out on this home.
Original Mortgage
$91,800
Interest Rate
6.4%
Mortgage Type
New Conventional
Create a Home Valuation Report for This Property
The Home Valuation Report is an in-depth analysis detailing your home's value as well as a comparison with similar homes in the area
Home Values in the Area
Average Home Value in this Area
Purchase History
| Date | Buyer | Sale Price | Title Company |
|---|---|---|---|
| J Mark Squier And Althea Squier Trust | -- | None Listed On Document | |
| Squier J Mark | $147,000 | -- | |
| Lobaugh Brandon | $91,875 | None Available |
Source: Public Records
Mortgage History
| Date | Status | Borrower | Loan Amount |
|---|---|---|---|
| Previous Owner | Squier J Mark | $117,560 | |
| Previous Owner | Lobaugh Brandon | $91,800 |
Source: Public Records
Tax History Compared to Growth
Tax History
| Year | Tax Paid | Tax Assessment Tax Assessment Total Assessment is a certain percentage of the fair market value that is determined by local assessors to be the total taxable value of land and additions on the property. | Land | Improvement |
|---|---|---|---|---|
| 2025 | $2,364 | $271,620 | $62,400 | $209,220 |
| 2024 | $2,364 | $257,910 | $42,000 | $215,910 |
| 2023 | $2,070 | $257,910 | $42,000 | $215,910 |
| 2022 | $2,050 | $184,060 | $42,000 | $142,060 |
| 2021 | $2,050 | $184,060 | $42,000 | $142,060 |
| 2020 | $1,874 | $163,290 | $44,940 | $118,350 |
| 2019 | $1,652 | $163,290 | $44,940 | $118,350 |
| 2018 | $1,638 | $144,030 | $25,680 | $118,350 |
| 2017 | $1,870 | $144,030 | $25,680 | $118,350 |
| 2016 | $1,916 | $144,030 | $0 | $0 |
| 2015 | $1,973 | $134,610 | $24,000 | $110,610 |
| 2014 | $1,871 | $134,610 | $24,000 | $110,610 |
Source: Public Records
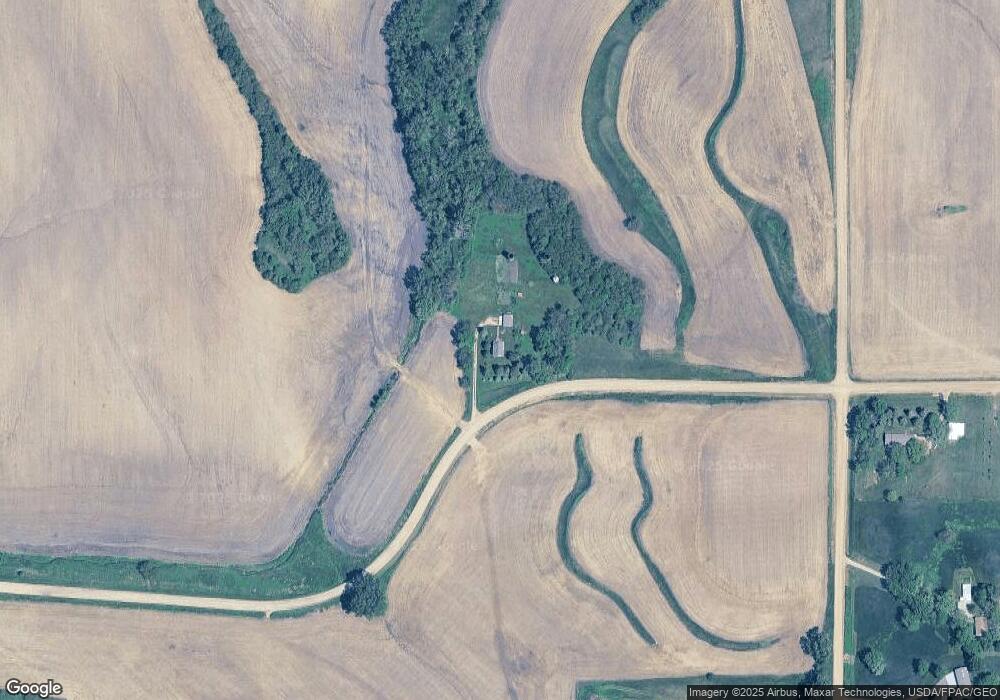
Map
Nearby Homes
- 6810 Brookside Dr
- 6700 Windsong Ct
- 6701 Windsong Ct
- 3441 Glen Ellen Rd
- 6540 Palm Valley Dr
- 17 Heritage Place
- 6413 Mickelson St
- 2564 Nicklaus Blvd
- 5225 Lynx Ct
- 5201 Lynx Ct
- 2640 Nicklaus Blvd
- 2600 Nicklaus Blvd
- 6290 Tiger Dr
- 6104 Pine View Dr
- 1441 170th St
- 5510 Christy Rd
- 6119 Morningside Ave
- 5260 Overlook Ln
- 5811 Lorraine Ave
- 1903 Elk Creek Rd
- 1616 180th St
- 1616 180th St
- 1827 Buchanan Ave
- 1832 Buchanan Ave
- 1844 Buchanan Ave
- 1624 180th St
- 1541 Old Highway 141
- 1628 180th St
- 1846 Buchanan Ave
- 1642 180th St
- 1550 180th St
- 0 Old Hwy 141 Unit 602463
- 0 Old Hwy 141 Unit 602563
- 1515 Old Highway 141
- 3800 Glen Ellen Rd
- 1538 Old Highway 141
- 1861 Buchanan Ave
- 1511 Old Highway 141
- 1528 Old Highway 141
- 1526 Old Highway 141