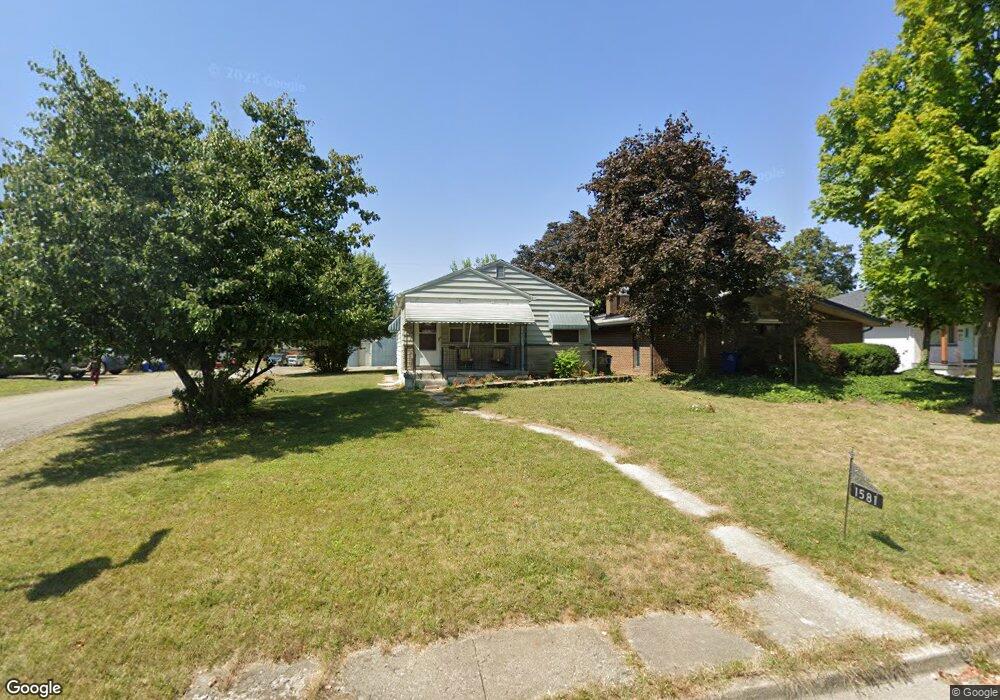
1581 Studer Ave Columbus, OH 43207
Edgewood NeighborhoodEstimated Value: $103,000 - $220,000
3
Beds
2
Baths
1,224
Sq Ft
$147/Sq Ft
Est. Value
About This Home
This home is located at 1581 Studer Ave, Columbus, OH 43207 and is currently estimated at $180,120, approximately $147 per square foot. 1581 Studer Ave is a home located in Franklin County with nearby schools including Moler Elementary School, South High School, and Capital Collegiate Preparatory Academy.
Ownership History
Date
Name
Owned For
Owner Type
Purchase Details
Closed on
Oct 28, 2014
Sold by
Consolidated Property Investments Ltd
Bought by
Dehays Brad J
Current Estimated Value
Purchase Details
Closed on
Jul 27, 2011
Sold by
Dehays Brad J
Bought by
Consolidated Property Investments Ltd
Purchase Details
Closed on
Apr 17, 2007
Sold by
Patton Andrew and Heslep Patricia
Bought by
Dehays Brad J
Purchase Details
Closed on
Feb 21, 2007
Sold by
Va
Bought by
Patton Andrew and Heslep Patricia
Purchase Details
Closed on
Aug 29, 2006
Sold by
Henry Robert J and Washington Mutual Bank Fa
Bought by
Va
Purchase Details
Closed on
Dec 30, 1993
Purchase Details
Closed on
Dec 7, 1990
Create a Home Valuation Report for This Property
The Home Valuation Report is an in-depth analysis detailing your home's value as well as a comparison with similar homes in the area
Home Values in the Area
Average Home Value in this Area
Purchase History
| Date | Buyer | Sale Price | Title Company |
|---|---|---|---|
| Dehays Brad J | -- | None Available | |
| Consolidated Property Investments Ltd | -- | Arrow Title | |
| Dehays Brad J | $51,500 | Metropolita | |
| Patton Andrew | -- | None Available | |
| Va | $53,231 | None Available | |
| -- | -- | -- | |
| -- | -- | -- |
Source: Public Records
Tax History
| Year | Tax Paid | Tax Assessment Tax Assessment Total Assessment is a certain percentage of the fair market value that is determined by local assessors to be the total taxable value of land and additions on the property. | Land | Improvement |
|---|---|---|---|---|
| 2025 | $2,054 | $44,810 | $13,410 | $31,400 |
| 2024 | $2,054 | $44,810 | $13,410 | $31,400 |
| 2023 | $2,028 | $44,800 | $13,405 | $31,395 |
| 2022 | $923 | $17,370 | $5,010 | $12,360 |
| 2021 | $925 | $17,370 | $5,010 | $12,360 |
| 2020 | $926 | $17,370 | $5,010 | $12,360 |
| 2019 | $858 | $13,800 | $4,170 | $9,630 |
| 2018 | $990 | $13,800 | $4,170 | $9,630 |
| 2017 | $1,046 | $13,800 | $4,170 | $9,630 |
| 2016 | $1,234 | $18,170 | $5,010 | $13,160 |
| 2015 | $1,124 | $18,170 | $5,010 | $13,160 |
| 2014 | $1,127 | $18,170 | $5,010 | $13,160 |
| 2013 | $584 | $19,110 | $5,250 | $13,860 |
Source: Public Records
Map
Nearby Homes
- 1514-1518 Wilson Ave
- 1571 Wilson Ave
- 1568 Oakwood Ave
- 1465 Lockbourne Rd
- 1739 Linwood Ave
- 1777 Lockbourne Rd
- 1472 S Champion Ave
- 1416 Oakwood Ave
- 1575 S Champion Ave
- 1718 Weiler Ave
- 1418-1422 Miller Ave
- 1398 Lockbourne Rd
- 1330 Frebis Ave
- 1366 Lockbourne Rd
- 1723 S Champion Ave
- 1352-1354 S Champion Ave
- 1350 Lockbourne Rd
- 1326 Studer Ave
- 1318 Lockbourne Rd
- 0 Oakwood Ave
- 1575 Studer Ave
- 1567 Studer Ave
- 1593 Studer Ave
- 1561 Studer Ave
- 1599 Studer Ave
- 1576 Linwood Ave
- 1555 Studer Ave
- 1605 Studer Ave
- 1588 Linwood Ave
- 1590 Studer Ave
- 1560 Linwood Ave
- 1582 Studer Ave
- 1600 Linwood Ave
- 1611 Studer Ave
- 1549 Studer Ave
- 1550 Linwood Ave
- 1564 Studer Ave
- 1564 Studer Ave
- 1615 Studer Ave
- 1606 Linwood Ave
Your Personal Tour Guide
Ask me questions while you tour the home.