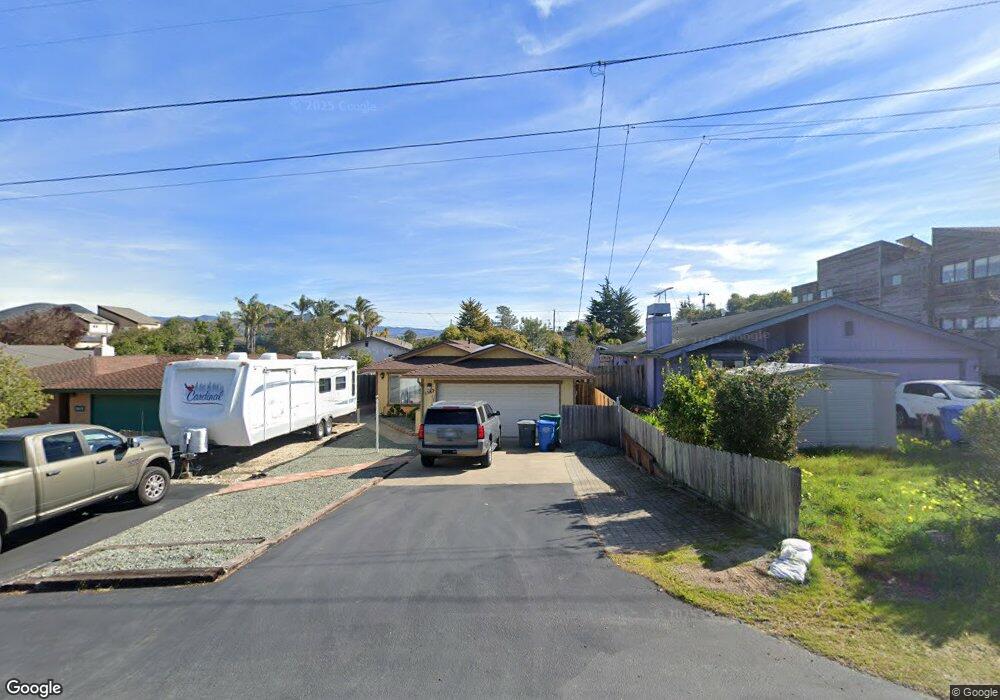
1582 9th St Los Osos, CA 93402
Estimated Value: $769,856 - $879,000
3
Beds
2
Baths
1,385
Sq Ft
$590/Sq Ft
Est. Value
About This Home
This home is located at 1582 9th St, Los Osos, CA 93402 and is currently estimated at $816,714, approximately $589 per square foot. 1582 9th St is a home located in San Luis Obispo County with nearby schools including Baywood Elementary School, Los Osos Middle School, and Morro Bay High School.
Ownership History
Date
Name
Owned For
Owner Type
Purchase Details
Closed on
Apr 9, 2010
Sold by
Donovan Gary R and Donovan Donna L
Bought by
Donovan Gary R and Donovan Donna L
Current Estimated Value
Purchase Details
Closed on
May 17, 1994
Sold by
Donovan Donna L and Donovan Gary R
Bought by
Donovan Gary R and Donovan Donna L
Home Financials for this Owner
Home Financials are based on the most recent Mortgage that was taken out on this home.
Original Mortgage
$23,000
Interest Rate
8.35%
Purchase Details
Closed on
Jan 28, 1994
Sold by
Donovan Donna L and Ashner Donna L
Bought by
Donovan Donna L and Donovan Gary R
Create a Home Valuation Report for This Property
The Home Valuation Report is an in-depth analysis detailing your home's value as well as a comparison with similar homes in the area
Home Values in the Area
Average Home Value in this Area
Purchase History
| Date | Buyer | Sale Price | Title Company |
|---|---|---|---|
| Donovan Gary R | -- | None Available | |
| Donovan Gary R | -- | Fidelity National Title | |
| Donovan Donna L | -- | -- |
Source: Public Records
Mortgage History
| Date | Status | Borrower | Loan Amount |
|---|---|---|---|
| Closed | Donovan Gary R | $23,000 |
Source: Public Records
Tax History
| Year | Tax Paid | Tax Assessment Tax Assessment Total Assessment is a certain percentage of the fair market value that is determined by local assessors to be the total taxable value of land and additions on the property. | Land | Improvement |
|---|---|---|---|---|
| 2025 | $2,446 | $174,969 | $59,738 | $115,231 |
| 2024 | $2,472 | $171,539 | $58,567 | $112,972 |
| 2023 | $2,472 | $168,176 | $57,419 | $110,757 |
| 2022 | $2,514 | $164,880 | $56,294 | $108,586 |
| 2021 | $2,503 | $161,648 | $55,191 | $106,457 |
| 2020 | $2,296 | $159,992 | $54,626 | $105,366 |
| 2019 | $2,300 | $156,855 | $53,555 | $103,300 |
| 2018 | $2,299 | $153,780 | $52,505 | $101,275 |
| 2017 | $2,249 | $150,766 | $51,476 | $99,290 |
| 2016 | $1,265 | $147,811 | $50,467 | $97,344 |
| 2015 | $1,253 | $145,591 | $49,709 | $95,882 |
| 2014 | $1,215 | $142,740 | $48,736 | $94,004 |
Source: Public Records
Map
Nearby Homes
Your Personal Tour Guide
Ask me questions while you tour the home.