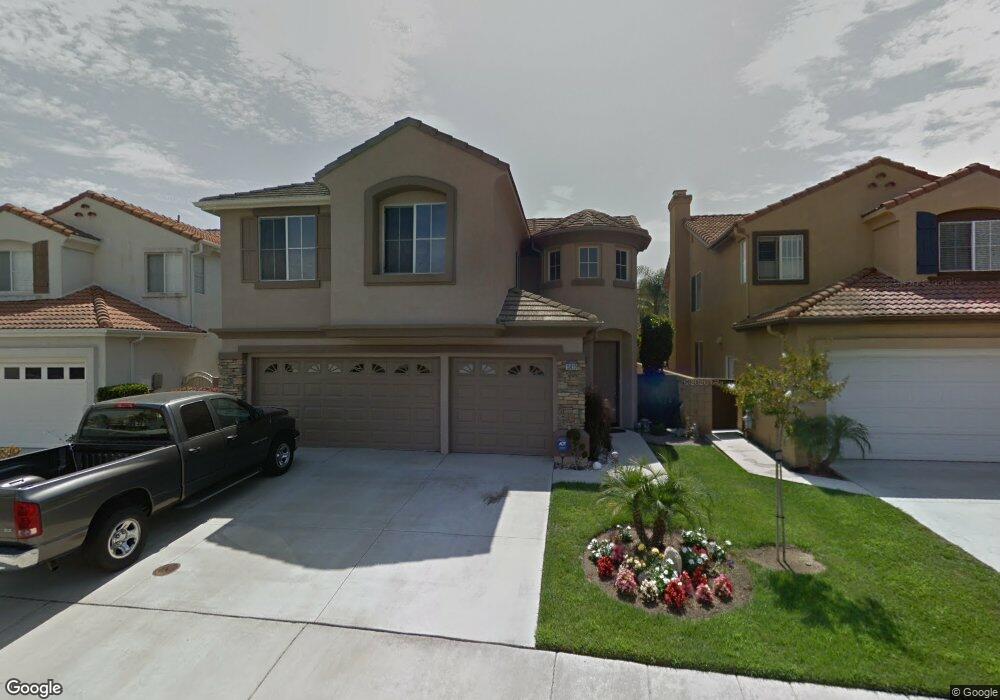
15829 Old Hickory Ln Chino Hills, CA 91709
Los Serranos NeighborhoodEstimated Value: $1,057,000 - $1,128,000
4
Beds
3
Baths
2,162
Sq Ft
$499/Sq Ft
Est. Value
About This Home
This home is located at 15829 Old Hickory Ln, Chino Hills, CA 91709 and is currently estimated at $1,078,616, approximately $498 per square foot. 15829 Old Hickory Ln is a home located in San Bernardino County with nearby schools including Chaparral Elementary School, Robert O. Townsend Junior High School, and Chino Hills High School.
Ownership History
Date
Name
Owned For
Owner Type
Purchase Details
Closed on
Dec 22, 2003
Sold by
Oh Heung Duck
Bought by
Paek Su Bok and Paek Chi Sook
Current Estimated Value
Home Financials for this Owner
Home Financials are based on the most recent Mortgage that was taken out on this home.
Original Mortgage
$354,750
Outstanding Balance
$165,990
Interest Rate
6.02%
Mortgage Type
Purchase Money Mortgage
Estimated Equity
$912,626
Purchase Details
Closed on
May 8, 2003
Sold by
Martin Shawn L
Bought by
Oh Heung Duck and Oh Kyung Ock
Home Financials for this Owner
Home Financials are based on the most recent Mortgage that was taken out on this home.
Original Mortgage
$316,000
Interest Rate
3.94%
Mortgage Type
Purchase Money Mortgage
Purchase Details
Closed on
May 14, 1999
Sold by
Lennar Homes Of California Inc
Bought by
Martin Shawn L and Martin Angeline
Home Financials for this Owner
Home Financials are based on the most recent Mortgage that was taken out on this home.
Original Mortgage
$248,000
Interest Rate
6.86%
Create a Home Valuation Report for This Property
The Home Valuation Report is an in-depth analysis detailing your home's value as well as a comparison with similar homes in the area
Home Values in the Area
Average Home Value in this Area
Purchase History
| Date | Buyer | Sale Price | Title Company |
|---|---|---|---|
| Paek Su Bok | $473,000 | Fidelity/Riverside | |
| Oh Heung Duck | $395,000 | First American | |
| Martin Shawn L | $261,500 | Chicago Title |
Source: Public Records
Mortgage History
| Date | Status | Borrower | Loan Amount |
|---|---|---|---|
| Open | Paek Su Bok | $354,750 | |
| Previous Owner | Oh Heung Duck | $316,000 | |
| Previous Owner | Martin Shawn L | $248,000 |
Source: Public Records
Tax History Compared to Growth
Tax History
| Year | Tax Paid | Tax Assessment Tax Assessment Total Assessment is a certain percentage of the fair market value that is determined by local assessors to be the total taxable value of land and additions on the property. | Land | Improvement |
|---|---|---|---|---|
| 2025 | $9,045 | $672,511 | $235,379 | $437,132 |
| 2024 | $9,045 | $659,325 | $230,764 | $428,561 |
| 2023 | $8,808 | $646,397 | $226,239 | $420,158 |
| 2022 | $8,730 | $633,723 | $221,803 | $411,920 |
| 2021 | $8,558 | $621,297 | $217,454 | $403,843 |
| 2020 | $8,435 | $614,926 | $215,224 | $399,702 |
| 2019 | $8,283 | $602,869 | $211,004 | $391,865 |
| 2018 | $8,102 | $591,048 | $206,867 | $384,181 |
| 2017 | $7,953 | $579,459 | $202,811 | $376,648 |
| 2016 | $7,503 | $568,097 | $198,834 | $369,263 |
| 2015 | $7,352 | $559,563 | $195,847 | $363,716 |
| 2014 | $6,958 | $525,000 | $184,000 | $341,000 |
Source: Public Records
Map
Nearby Homes
- 15849 Tanberry Dr
- 15906 Kingston Rd
- 15892 Tanberry Dr
- 15946 Ellington Way
- 15920 Ellington Way
- 15841 Ellington Way
- 5165 Pomona Rincon Rd
- 5177 Pomona Rincon Rd
- 0 Pomona Rincon Rd Unit TR19286701
- 15508 Quail St
- 5142 Cellini Dr
- 4718 El Molino Ln
- 4570 Willow Bend Ct
- 15597 Timberidge Ln
- 5521 Stargaze St
- 15366 Carmelita Ave
- 4441 Los Serranos Blvd
- 4479 Saint Andrews Dr
- 15239 Murray Ave
- 16349 Misty Hill Dr
- 15835 Old Hickory Ln
- 15823 Old Hickory Ln Unit 1400
- 15823 Old Hickory Ln
- 15817 Old Hickory Ln
- 15870 Madelyn Ct
- 15876 Madelyn Ct
- 15882 Madelyn Ct
- 15864 Madelyn Ct
- 15811 Old Hickory Ln
- 15888 Madelyn Ct
- 15826 Old Hickory Ln
- 15858 Madelyn Ct
- 15832 Old Hickory Ln
- 15820 Old Hickory Ln
- 15863 Silver Springs Dr
- 15857 Silver Springs Dr
- 15869 Silver Springs Dr
- 15838 Old Hickory Ln
- 15852 Madelyn Ct
- 15805 Old Hickory Ln