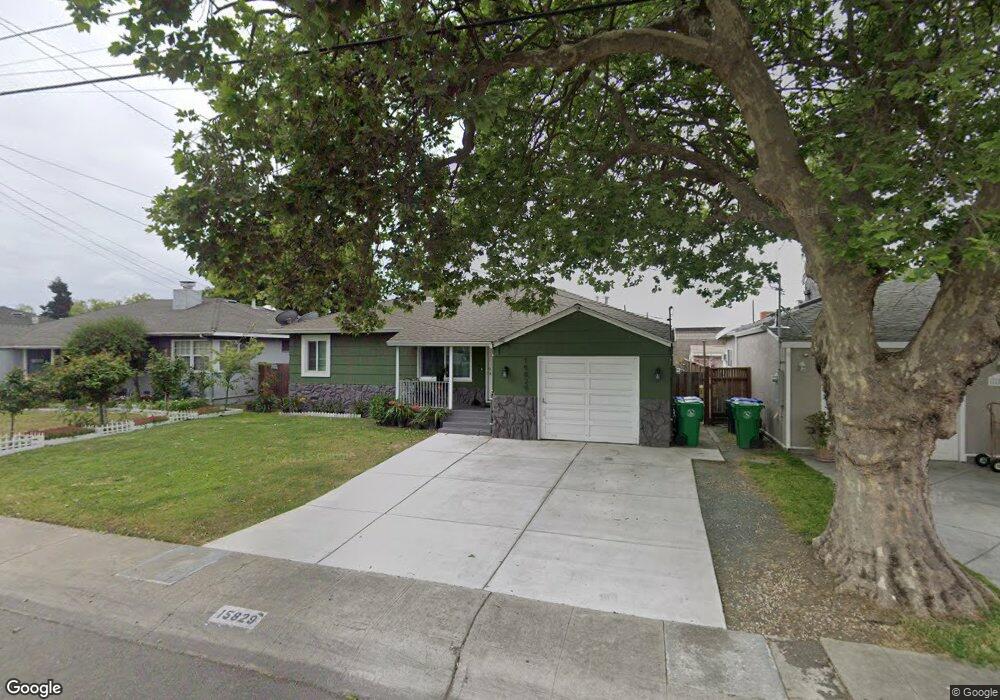
15829 Via Arroyo San Lorenzo, CA 94580
Estimated Value: $688,093 - $752,000
3
Beds
1
Bath
1,062
Sq Ft
$681/Sq Ft
Est. Value
About This Home
This home is located at 15829 Via Arroyo, San Lorenzo, CA 94580 and is currently estimated at $722,773, approximately $680 per square foot. 15829 Via Arroyo is a home located in Alameda County with nearby schools including Grant Elementary School, Washington Manor Middle School, and San Lorenzo High School.
Ownership History
Date
Name
Owned For
Owner Type
Purchase Details
Closed on
Apr 8, 2016
Sold by
Trinidad Jose B and Trinidad Flordeliza P
Bought by
Trinidad Billy
Current Estimated Value
Home Financials for this Owner
Home Financials are based on the most recent Mortgage that was taken out on this home.
Original Mortgage
$255,000
Outstanding Balance
$202,316
Interest Rate
3.64%
Mortgage Type
New Conventional
Estimated Equity
$520,457
Purchase Details
Closed on
Dec 8, 2003
Sold by
Trinidad Jose B and Trinidad Flordeliza P
Bought by
Trinidad Jose B and Trinidad Flordeliza P
Home Financials for this Owner
Home Financials are based on the most recent Mortgage that was taken out on this home.
Original Mortgage
$145,000
Interest Rate
5.92%
Mortgage Type
Purchase Money Mortgage
Purchase Details
Closed on
Sep 16, 2000
Sold by
Trinidad Jose B and Trinidad Flordeliza P
Bought by
Trinidad Billy
Create a Home Valuation Report for This Property
The Home Valuation Report is an in-depth analysis detailing your home's value as well as a comparison with similar homes in the area
Home Values in the Area
Average Home Value in this Area
Purchase History
| Date | Buyer | Sale Price | Title Company |
|---|---|---|---|
| Trinidad Billy | $170,000 | Old Republic Title Company | |
| Trinidad Jose B | $48,500 | Old Republic Title Company | |
| Trinidad Billy | -- | -- |
Source: Public Records
Mortgage History
| Date | Status | Borrower | Loan Amount |
|---|---|---|---|
| Open | Trinidad Billy | $255,000 | |
| Previous Owner | Trinidad Jose B | $145,000 |
Source: Public Records
Tax History Compared to Growth
Tax History
| Year | Tax Paid | Tax Assessment Tax Assessment Total Assessment is a certain percentage of the fair market value that is determined by local assessors to be the total taxable value of land and additions on the property. | Land | Improvement |
|---|---|---|---|---|
| 2025 | $1,764 | $82,927 | $52,400 | $30,527 |
| 2024 | $1,764 | $81,301 | $51,373 | $29,928 |
| 2023 | $1,776 | $79,707 | $50,366 | $29,341 |
| 2022 | $1,646 | $71,144 | $49,378 | $28,766 |
| 2021 | $1,589 | $69,612 | $48,410 | $28,202 |
| 2020 | $1,538 | $75,827 | $47,914 | $27,913 |
| 2019 | $1,518 | $74,340 | $46,974 | $27,366 |
| 2018 | $1,388 | $72,882 | $46,053 | $26,829 |
| 2017 | $1,306 | $71,453 | $45,150 | $26,303 |
| 2016 | $1,240 | $70,052 | $44,265 | $25,787 |
| 2015 | $1,209 | $69,000 | $43,600 | $25,400 |
| 2014 | $1,190 | $67,648 | $42,746 | $24,902 |
Source: Public Records
Map
Nearby Homes
- 15958 Via Descanso
- 15867 Hesperian Blvd
- 15609 Ronda St
- 15539 Usher St
- 15540 Hesperian Blvd
- 181 E Lewelling Blvd
- 638 Paseo Del Rio
- 179 Loma Verde Dr
- 17779 Rainier Ave
- 16011 Via Conejo
- 263 Ano Ave
- 16829 Daryl Ave
- 17754 Meekland Ave Unit 1
- 0 E 14th St Unit 41059501
- 16050 Via Olinda
- 17347 Via Encinas
- 17316 Via Flores
- 16960 Westerman Ct
- 17761 Via Arriba
- 920 Elgin St Unit G
- 15825 Via Arroyo
- 15833 Via Arroyo
- 15821 Via Arroyo
- 15837 Via Arroyo
- 15830 Via Arroyo
- 15826 Via Arroyo
- 15841 Via Arroyo
- 15817 Via Arroyo
- 15834 Via Arroyo
- 15845 Via Arroyo
- 15818 Via Arroyo
- 15813 Via Arroyo
- 15842 Via Arroyo
- 15827 Via Rivera
- 15814 Via Arroyo
- 15831 Via Rivera
- 15823 Via Rivera
- 15849 Via Arroyo
- 15809 Via Arroyo
- 15835 Via Rivera