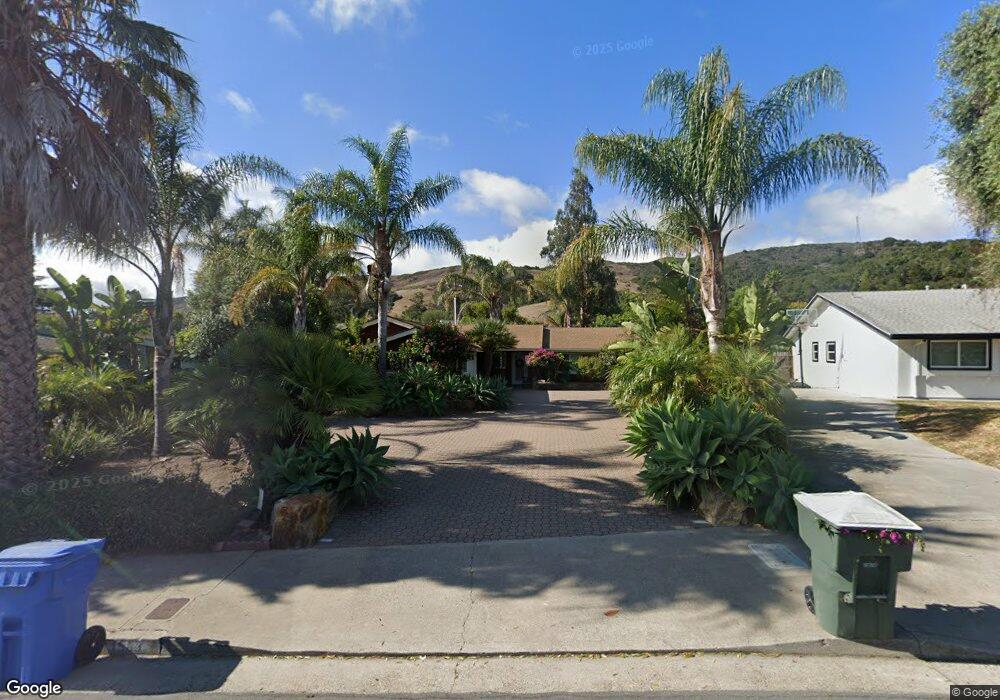
1583 Royal Way San Luis Obispo, CA 93405
Billygoat Acres NeighborhoodEstimated Value: $860,166 - $1,022,000
3
Beds
2
Baths
1,388
Sq Ft
$675/Sq Ft
Est. Value
About This Home
This home is located at 1583 Royal Way, San Luis Obispo, CA 93405 and is currently estimated at $936,292, approximately $674 per square foot. 1583 Royal Way is a home located in San Luis Obispo County with nearby schools including C.L. Smith Elementary School, Laguna Middle School, and San Luis Obispo High School.
Ownership History
Date
Name
Owned For
Owner Type
Purchase Details
Closed on
Aug 25, 2010
Sold by
Wilcox Timothy P and Wilcox Jana C
Bought by
Wilcox Timothy P and Wilcox Jana C
Current Estimated Value
Home Financials for this Owner
Home Financials are based on the most recent Mortgage that was taken out on this home.
Original Mortgage
$259,000
Interest Rate
4.38%
Mortgage Type
New Conventional
Purchase Details
Closed on
Sep 7, 2007
Sold by
Wilcox Timothy P and Wilcox Jana C
Bought by
Wilcox Timothy P and Wilcox Jana C
Purchase Details
Closed on
Mar 14, 2006
Sold by
Wilcox Jana Christine and Baker Randall Harold
Bought by
Wilcox Jana Christine
Purchase Details
Closed on
Mar 13, 2006
Sold by
Wilcox Timothy P
Bought by
Wilcox Jana Christine
Create a Home Valuation Report for This Property
The Home Valuation Report is an in-depth analysis detailing your home's value as well as a comparison with similar homes in the area
Home Values in the Area
Average Home Value in this Area
Purchase History
| Date | Buyer | Sale Price | Title Company |
|---|---|---|---|
| Wilcox Timothy P | -- | First American Title Company | |
| Wilcox Timothy P | -- | First American Title Company | |
| Wilcox Timothy P | -- | None Available | |
| Wilcox Timothy P | -- | None Available | |
| Wilcox Jana Christine | -- | Public | |
| Wilcox Jana Christine | -- | Public |
Source: Public Records
Mortgage History
| Date | Status | Borrower | Loan Amount |
|---|---|---|---|
| Closed | Wilcox Timothy P | $259,000 |
Source: Public Records
Tax History Compared to Growth
Tax History
| Year | Tax Paid | Tax Assessment Tax Assessment Total Assessment is a certain percentage of the fair market value that is determined by local assessors to be the total taxable value of land and additions on the property. | Land | Improvement |
|---|---|---|---|---|
| 2025 | $1,327 | $122,478 | $35,503 | $86,975 |
| 2024 | $1,303 | $120,077 | $34,807 | $85,270 |
| 2023 | $1,303 | $117,724 | $34,125 | $83,599 |
| 2022 | $1,221 | $115,416 | $33,456 | $81,960 |
| 2021 | $1,202 | $113,153 | $32,800 | $80,353 |
| 2020 | $1,190 | $111,994 | $32,464 | $79,530 |
| 2019 | $1,177 | $109,799 | $31,828 | $77,971 |
| 2018 | $1,154 | $107,647 | $31,204 | $76,443 |
| 2017 | $1,132 | $105,538 | $30,593 | $74,945 |
| 2016 | $1,109 | $103,470 | $29,994 | $73,476 |
| 2015 | $1,093 | $101,917 | $29,544 | $72,373 |
| 2014 | $1,003 | $99,922 | $28,966 | $70,956 |
Source: Public Records
Map
Nearby Homes
- 11295 Los Osos Valley Rd Unit 14
- 1845 Thelma Dr Unit 59
- 1809 Thelma Dr Unit 50
- 1020 Ilene Dr
- 1129 Vista Del Lago
- 1466 Balboa St
- 1545 Descanso St
- 915 Madonna Rd Unit 102
- 967 Capistrano Ct
- 1556 Gulf St
- 897 Isabella Way
- 905 Madonna Rd Unit 79
- 1372 Diablo Dr
- 932 Legacy Ln
- 908 Legacy Ln
- 1929 San Luis Ranch Rd
- 730 Via Laguna Vista
- 2040 Prado Rd
- 1675 Nasella Ln
- 3960 S Higuera St Unit 79