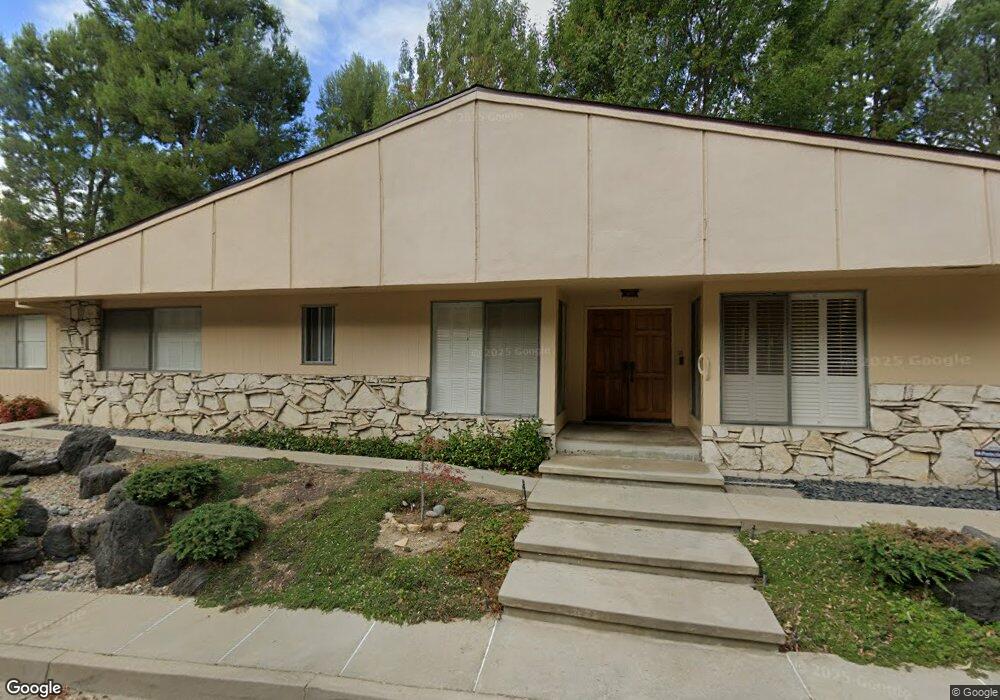
15831 Royal Meadow Place Sherman Oaks, CA 91403
Estimated Value: $1,900,000 - $2,234,000
4
Beds
3
Baths
2,326
Sq Ft
$900/Sq Ft
Est. Value
About This Home
This home is located at 15831 Royal Meadow Place, Sherman Oaks, CA 91403 and is currently estimated at $2,093,523, approximately $900 per square foot. 15831 Royal Meadow Place is a home located in Los Angeles County with nearby schools including Van Nuys High School, Ivy Bound Academy of Math Sci and Tech Charter Middle, and Sherman Oaks Elementary Charter School.
Create a Home Valuation Report for This Property
The Home Valuation Report is an in-depth analysis detailing your home's value as well as a comparison with similar homes in the area
Home Values in the Area
Average Home Value in this Area
Tax History Compared to Growth
Tax History
| Year | Tax Paid | Tax Assessment Tax Assessment Total Assessment is a certain percentage of the fair market value that is determined by local assessors to be the total taxable value of land and additions on the property. | Land | Improvement |
|---|---|---|---|---|
| 2025 | $2,809 | $194,220 | $77,687 | $116,533 |
| 2024 | $2,809 | $190,413 | $76,164 | $114,249 |
| 2023 | $2,763 | $186,680 | $74,671 | $112,009 |
| 2022 | $2,672 | $183,020 | $73,207 | $109,813 |
| 2021 | $2,629 | $179,432 | $71,772 | $107,660 |
| 2019 | $2,561 | $174,113 | $69,645 | $104,468 |
| 2018 | $2,481 | $170,700 | $68,280 | $102,420 |
| 2016 | $2,342 | $164,074 | $65,630 | $98,444 |
| 2015 | $2,313 | $161,611 | $64,645 | $96,966 |
| 2014 | $2,335 | $158,446 | $63,379 | $95,067 |
Source: Public Records
Map
Nearby Homes
- 3873 Royal Woods Dr
- 15656 Crownridge Place
- 3847 Royal Woods Dr
- 16187 Royal Oak Rd
- 15508 Royal Ridge Rd
- 3539 Alana Dr
- 3563 Alana Dr
- 4009 Valley Meadow Rd
- 3421 Castlewoods Place
- 3530 Royal Woods Dr
- 3585 Alana Dr
- 16138 Meadowcrest Rd
- 4121 Regal Oak Dr
- 15901 High Knoll Rd
- 3535 Vista Haven Rd
- 16101 Royal Mount Dr
- 4230 Valley Meadow Rd
- 15570 Briarwood Dr
- 4041 Sapphire Dr
- 4053 Hayvenhurst Dr
- 15821 Royal Meadow Place
- 3759 Royal Meadow Rd
- 3730 Valley Meadow Rd
- 15851 Royal Meadow Place
- 3767 Royal Meadow Rd
- 3741 Royal Meadow Rd
- 3728 Valley Meadow Rd
- 15811 Royal Meadow Place
- 15801 Royal Meadow Place
- 3800 Valley Meadow Rd
- 3725 Royal Meadow Rd
- 3694 Valley Meadow Rd
- 3811 Royal Meadow Rd
- 3762 Royal Meadow Rd
- 3831 Sepulveda Blvd Unit 1
- 3768 Royal Meadow Rd
- 3730 Royal Meadow Rd
- 3819 Royal Meadow Rd
- 3721 Valley Meadow Rd