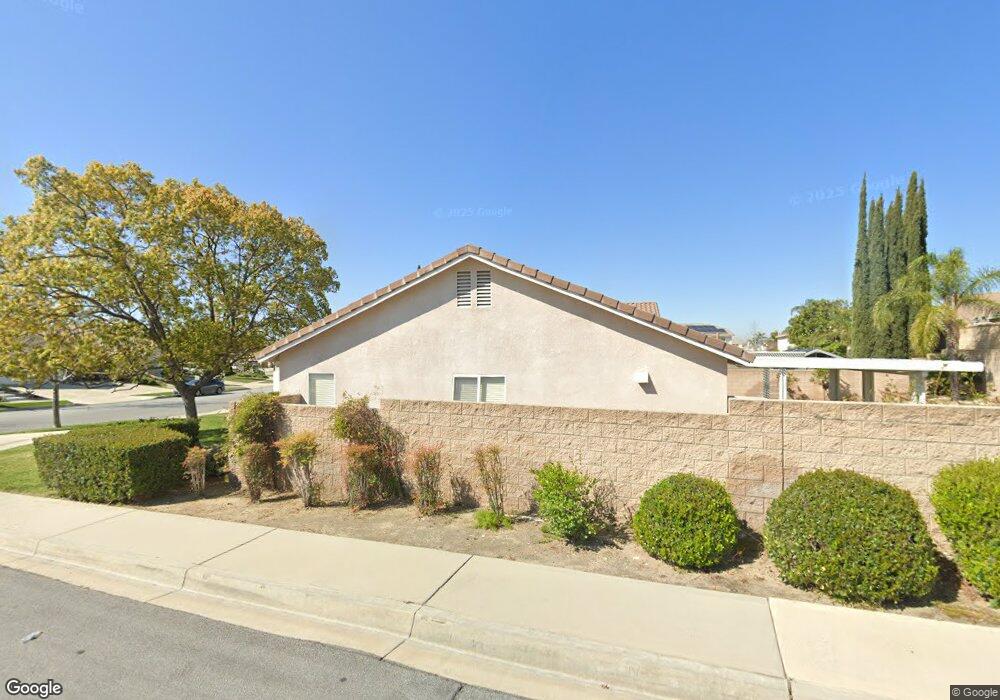
15838 Cascade Dr Fontana, CA 92336
Rancho Fontana NeighborhoodEstimated Value: $652,006 - $692,000
3
Beds
2
Baths
1,679
Sq Ft
$400/Sq Ft
Est. Value
About This Home
This home is located at 15838 Cascade Dr, Fontana, CA 92336 and is currently estimated at $671,252, approximately $399 per square foot. 15838 Cascade Dr is a home located in San Bernardino County with nearby schools including Dorothy Grant Elementary School, Wayne Ruble Middle School, and Summit High School.
Ownership History
Date
Name
Owned For
Owner Type
Purchase Details
Closed on
Feb 19, 2002
Sold by
Hallihan Richard A
Bought by
Hallihan Richard A and The Richard Hallihan Family Tr
Current Estimated Value
Home Financials for this Owner
Home Financials are based on the most recent Mortgage that was taken out on this home.
Original Mortgage
$124,600
Outstanding Balance
$47,646
Interest Rate
6%
Estimated Equity
$623,606
Purchase Details
Closed on
May 16, 2000
Sold by
Hallihan Richard
Bought by
Hallihan Richard A and Richard Hallihan Family Trust
Purchase Details
Closed on
Feb 23, 2000
Sold by
William Lyon Homes Inc
Bought by
Hallihan Richard
Home Financials for this Owner
Home Financials are based on the most recent Mortgage that was taken out on this home.
Original Mortgage
$120,750
Interest Rate
7.87%
Create a Home Valuation Report for This Property
The Home Valuation Report is an in-depth analysis detailing your home's value as well as a comparison with similar homes in the area
Home Values in the Area
Average Home Value in this Area
Purchase History
| Date | Buyer | Sale Price | Title Company |
|---|---|---|---|
| Hallihan Richard A | -- | First American Title | |
| Hallihan Richard A | -- | First American Title | |
| Hallihan Richard A | -- | -- | |
| Hallihan Richard | $151,000 | Chicago Title |
Source: Public Records
Mortgage History
| Date | Status | Borrower | Loan Amount |
|---|---|---|---|
| Open | Hallihan Richard A | $124,600 | |
| Closed | Hallihan Richard | $120,750 |
Source: Public Records
Tax History Compared to Growth
Tax History
| Year | Tax Paid | Tax Assessment Tax Assessment Total Assessment is a certain percentage of the fair market value that is determined by local assessors to be the total taxable value of land and additions on the property. | Land | Improvement |
|---|---|---|---|---|
| 2025 | $3,396 | $232,070 | $57,636 | $174,434 |
| 2024 | $3,396 | $227,520 | $56,506 | $171,014 |
| 2023 | $2,947 | $223,059 | $55,398 | $167,661 |
| 2022 | $3,518 | $218,686 | $54,312 | $164,374 |
| 2021 | $3,481 | $214,398 | $53,247 | $161,151 |
| 2020 | $3,460 | $212,200 | $52,701 | $159,499 |
| 2019 | $3,391 | $208,040 | $51,668 | $156,372 |
| 2018 | $3,404 | $203,961 | $50,655 | $153,306 |
| 2017 | $3,364 | $199,962 | $49,662 | $150,300 |
| 2016 | $3,300 | $196,041 | $48,688 | $147,353 |
| 2015 | $3,252 | $193,097 | $47,957 | $145,140 |
| 2014 | $3,239 | $189,315 | $47,018 | $142,297 |
Source: Public Records
Map
Nearby Homes
- 16040 Jamie Ln Unit 9
- 16040 Jamie Ln Unit 8
- 16040 Parkhouse Dr Unit 1
- 16502 Casa Grande Ave Unit 102
- 16681 Wyndham Ln Unit 2
- 16540 Wyndham Ln Unit 10
- 16620 Wyndham Ln Unit 11
- 16548 Monteviejo St
- 16502 Casa Grande Ave Unit 235
- 16004 Cascade Dr
- 15931 Los Cedros Ave
- 7140 Melody Dr
- 6973 Lisa Dr
- 7170 Melody Dr
- 16001 Chase Rd Unit 96
- 16001 Chase Rd Unit 59
- 16573 Botanical Ln
- 7144 Riley Dr
- 15629 Aerostar Ct
- 15752 Mimosa Ct
- 15839 Allison Way
- 15823 Allison Way
- 15852 Cascade Dr
- 15853 Allison Way
- 7017 Almeria Ave
- 15821 Allison Way
- 15837 Cascade Dr
- 15860 Cascade Dr
- 15845 Cascade Dr
- 7007 Almeria Ave
- 15861 Allison Way
- 15821 Cascade Dr
- 15853 Cascade Dr
- 6958 Mia Ct
- 6997 Almeria Ave
- 15868 Cascade Dr
- 6948 Catawba Dr
- 15869 Allison Way
- 15861 Cascade Dr
- 7037 Almeria Ave