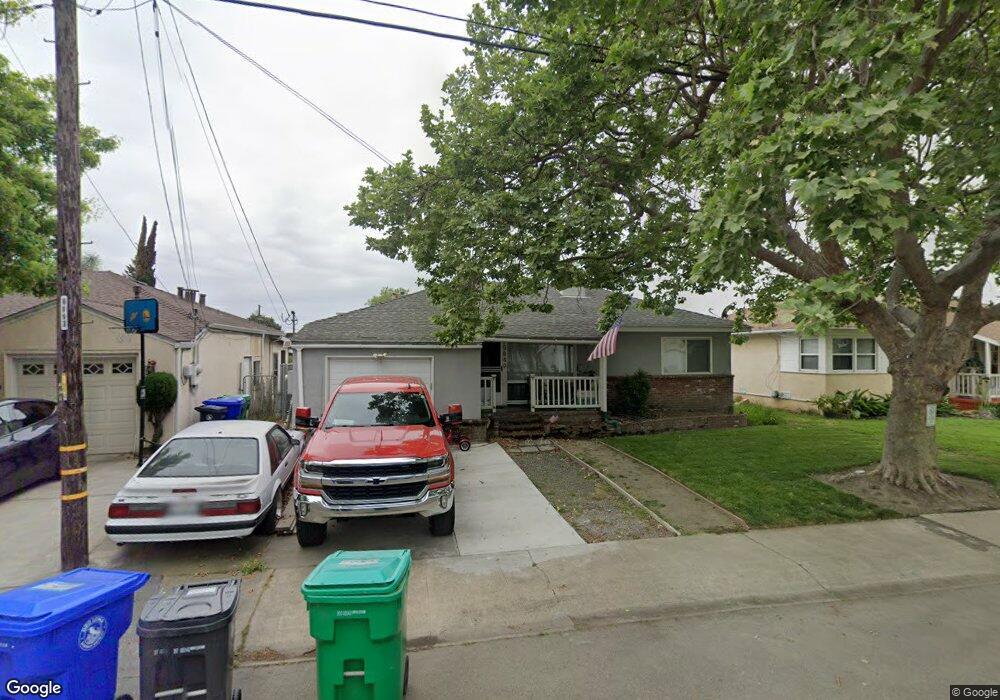
15849 Via Arroyo San Lorenzo, CA 94580
Estimated Value: $701,000 - $760,000
3
Beds
1
Bath
1,062
Sq Ft
$692/Sq Ft
Est. Value
About This Home
This home is located at 15849 Via Arroyo, San Lorenzo, CA 94580 and is currently estimated at $734,907, approximately $692 per square foot. 15849 Via Arroyo is a home located in Alameda County with nearby schools including Grant Elementary School, Washington Manor Middle School, and San Lorenzo High School.
Ownership History
Date
Name
Owned For
Owner Type
Purchase Details
Closed on
Aug 19, 2013
Sold by
Hicks Charles G and Vera R Hicks Trust
Bought by
Barragan Armando
Current Estimated Value
Home Financials for this Owner
Home Financials are based on the most recent Mortgage that was taken out on this home.
Original Mortgage
$261,182
Outstanding Balance
$195,081
Interest Rate
4.5%
Mortgage Type
FHA
Estimated Equity
$539,826
Purchase Details
Closed on
Feb 22, 2007
Sold by
Hicks Vera R
Bought by
Hicks Vera R and The Vera R Hicks Trust
Purchase Details
Closed on
May 9, 2000
Sold by
Hicks Vera R
Bought by
Hicks Vera R
Home Financials for this Owner
Home Financials are based on the most recent Mortgage that was taken out on this home.
Original Mortgage
$329,773
Interest Rate
8.27%
Create a Home Valuation Report for This Property
The Home Valuation Report is an in-depth analysis detailing your home's value as well as a comparison with similar homes in the area
Home Values in the Area
Average Home Value in this Area
Purchase History
| Date | Buyer | Sale Price | Title Company |
|---|---|---|---|
| Barragan Armando | $266,000 | North American Title Company | |
| Hicks Vera R | -- | None Available | |
| Hicks Vera R | -- | None Available | |
| Hicks Vera R | -- | American Title Co |
Source: Public Records
Mortgage History
| Date | Status | Borrower | Loan Amount |
|---|---|---|---|
| Open | Barragan Armando | $261,182 | |
| Previous Owner | Hicks Vera R | $329,773 | |
| Closed | Hicks Vera R | $329,773 |
Source: Public Records
Tax History Compared to Growth
Tax History
| Year | Tax Paid | Tax Assessment Tax Assessment Total Assessment is a certain percentage of the fair market value that is determined by local assessors to be the total taxable value of land and additions on the property. | Land | Improvement |
|---|---|---|---|---|
| 2025 | $6,004 | $447,420 | $134,226 | $313,194 |
| 2024 | $6,004 | $438,648 | $131,594 | $307,054 |
| 2023 | $5,979 | $430,050 | $129,015 | $301,035 |
| 2022 | $5,888 | $421,618 | $126,485 | $295,133 |
| 2021 | $5,726 | $413,354 | $124,006 | $289,348 |
| 2020 | $5,600 | $409,117 | $122,735 | $286,382 |
| 2019 | $5,605 | $401,097 | $120,329 | $280,768 |
| 2018 | $5,339 | $393,235 | $117,970 | $275,265 |
| 2017 | $5,046 | $385,527 | $115,658 | $269,869 |
| 2016 | $4,814 | $377,967 | $113,390 | $264,577 |
| 2015 | $4,710 | $372,291 | $111,687 | $260,604 |
| 2014 | $4,641 | $365,000 | $109,500 | $255,500 |
Source: Public Records
Map
Nearby Homes
- 15958 Via Descanso
- 15867 Hesperian Blvd
- 15609 Ronda St
- 16045 Via Cordoba
- 181 E Lewelling Blvd
- 179 Loma Verde Dr
- 15539 Usher St
- 15540 Hesperian Blvd
- 638 Paseo Del Rio
- 72 Via Morella
- 17779 Rainier Ave
- 16011 Via Conejo
- 17754 Meekland Ave Unit 1
- 16829 Daryl Ave
- 16050 Via Olinda
- 0 E 14th St Unit 41059501
- 17347 Via Encinas
- 17316 Via Flores
- 17761 Via Arriba
- 334 Oxford St
- 15853 Via Arroyo
- 15845 Via Arroyo
- 15857 Via Arroyo
- 15841 Via Arroyo
- 15846 Via Arroyo
- 15850 Via Arroyo
- 15861 Via Arroyo
- 15837 Via Arroyo
- 15842 Via Arroyo
- 15855 Via Rivera
- 15901 Via Arroyo
- 15833 Via Arroyo
- 15847 Via Rivera
- 15843 Via Rivera
- 15851 Via Rivera
- 15839 Via Rivera
- 15834 Via Arroyo
- 15910 Via Descanso
- 15909 Via Arroyo
- 15829 Via Arroyo