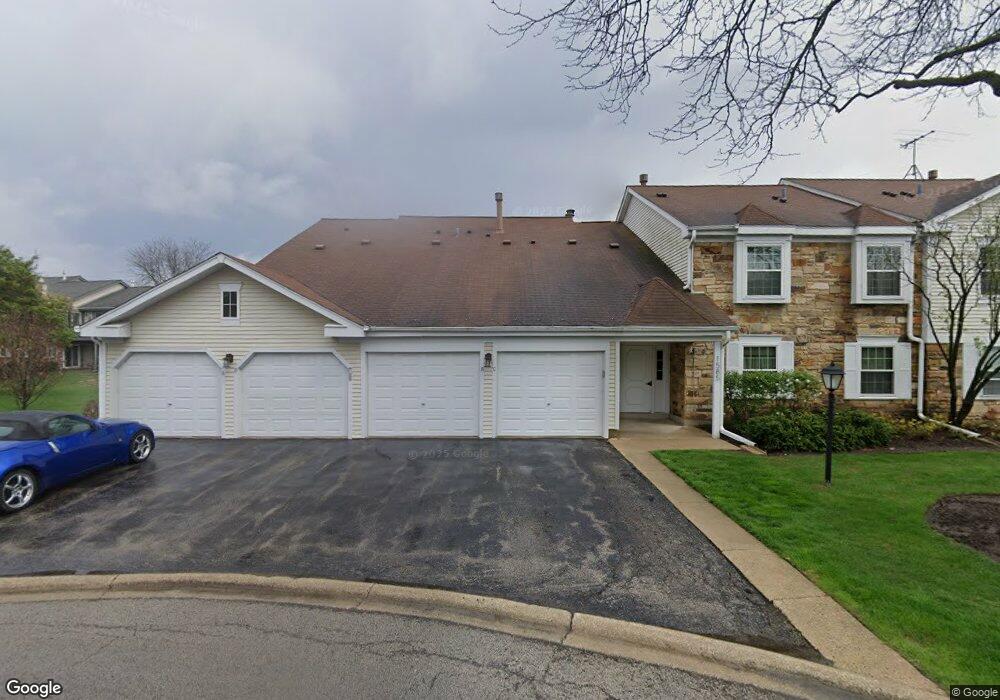
1585 Stonehill Ct Unit C Wheaton, IL 60189
West Wheaton NeighborhoodEstimated Value: $235,100 - $274,000
2
Beds
1
Bath
965
Sq Ft
$259/Sq Ft
Est. Value
About This Home
This home is located at 1585 Stonehill Ct Unit C, Wheaton, IL 60189 and is currently estimated at $250,025, approximately $259 per square foot. 1585 Stonehill Ct Unit C is a home located in DuPage County with nearby schools including Madison Elementary School, Edison Middle School, and Wheaton Warrenville South High School.
Ownership History
Date
Name
Owned For
Owner Type
Purchase Details
Closed on
Dec 4, 2008
Sold by
Lambie David M
Bought by
Lambie David M and Lambie Mary E
Current Estimated Value
Purchase Details
Closed on
Dec 28, 2001
Sold by
Romack Gregory A and Romack Patricia A
Bought by
Lambie David
Home Financials for this Owner
Home Financials are based on the most recent Mortgage that was taken out on this home.
Original Mortgage
$105,000
Outstanding Balance
$43,579
Interest Rate
7.26%
Estimated Equity
$206,446
Purchase Details
Closed on
Dec 2, 1999
Sold by
Romack Gregory
Bought by
Romack Gregory and Romack Patricia
Purchase Details
Closed on
Aug 13, 1997
Sold by
Kulinowski Donald P
Bought by
Romack Gregory
Home Financials for this Owner
Home Financials are based on the most recent Mortgage that was taken out on this home.
Original Mortgage
$95,850
Interest Rate
7.55%
Create a Home Valuation Report for This Property
The Home Valuation Report is an in-depth analysis detailing your home's value as well as a comparison with similar homes in the area
Home Values in the Area
Average Home Value in this Area
Purchase History
We collect this data history from publicly available records. To have your information removed, we recommend requesting removal directly through your county’s website.
| Date | Buyer | Sale Price | Title Company |
|---|---|---|---|
| Lambie David M | -- | None Available | |
| Lambie David | $132,500 | First American Title | |
| Romack Gregory | -- | First American Title Ins | |
| Romack Gregory | $106,500 | -- |
Source: Public Records
Mortgage History
We collect this data history from publicly available records. To have your information removed, we recommend requesting removal directly through your county’s website.
| Date | Status | Borrower | Loan Amount |
|---|---|---|---|
| Open | Lambie David | $105,000 | |
| Previous Owner | Romack Gregory | $95,850 |
Source: Public Records
Tax History
| Year | Tax Paid | Tax Assessment Tax Assessment Total Assessment is a certain percentage of the fair market value that is determined by local assessors to be the total taxable value of land and additions on the property. | Land | Improvement |
|---|---|---|---|---|
| 2024 | -- | $70,746 | $5,649 | $65,097 |
| 2023 | $3,871 | $65,120 | $5,200 | $59,920 |
| 2022 | $3,108 | $50,750 | $4,910 | $45,840 |
| 2021 | $3,091 | $49,540 | $4,790 | $44,750 |
| 2020 | $3,078 | $49,070 | $4,740 | $44,330 |
| 2019 | $3,000 | $47,770 | $4,610 | $43,160 |
| 2018 | $2,608 | $41,900 | $4,340 | $37,560 |
| 2017 | $2,376 | $37,910 | $3,930 | $33,980 |
| 2016 | $2,330 | $36,390 | $3,770 | $32,620 |
| 2015 | $2,297 | $34,720 | $3,600 | $31,120 |
| 2014 | $3,272 | $46,230 | $4,760 | $41,470 |
| 2013 | $3,189 | $46,360 | $4,770 | $41,590 |
Source: Public Records
Map
Nearby Homes
- 1S728 Shaffner Rd
- 1S710 Shaffner Rd
- 1477 S County Farm Rd Unit 1-1
- 1420 Stonebridge Cir Unit 5N
- 2105 Timber Ln
- 2101 Timber Ln
- 1520 Stonebridge Trail Unit 2-1
- 26W421 Wiesbrook Rd
- 1760 Shaffner Rd
- 1s050 Shaffner Rd
- 1862 W Wiesbrook Rd
- 1921 Wexford Cir
- 1601 W Wiesbrook Rd
- 0S775 Madison St
- 1570 Orchard Rd
- 2S510 Seneca Dr
- 1519 Foothill Dr
- 927 Kilkenny Dr Unit A
- 0S635 Robbins St
- 2S560 Seneca Dr
- 1541 Sandhurst Ct Unit B
- 1580 Stonehill Ct Unit C
- 1571 Burr Oak Ct Unit B
- 1550 Sandhurst Ct Unit D
- 1541 Sandhurst Ct Unit A
- 1550 Sandhurst Ct Unit C
- 1572 Stonehill Ct Unit B
- 1585 Stonehill Ct Unit A
- 1588 Stonehill Ct Unit B
- 1588 Stonehill Ct Unit D
- 1571 Burr Oak Ct Unit A
- 1576 Burr Oak Ct Unit B
- 1580 Stonehill Ct Unit D
- 1585 Stonehill Ct Unit D
- 1550 Sandhurst Ct Unit A
- 1590 Burr Oak Ct Unit A
- 1590 Burr Oak Ct Unit D
- 1541 Sandhurst Ct Unit C
- 1576 Burr Oak Ct Unit D
- 1570 Burr Oak Ct Unit A
Your Personal Tour Guide
Ask me questions while you tour the home.