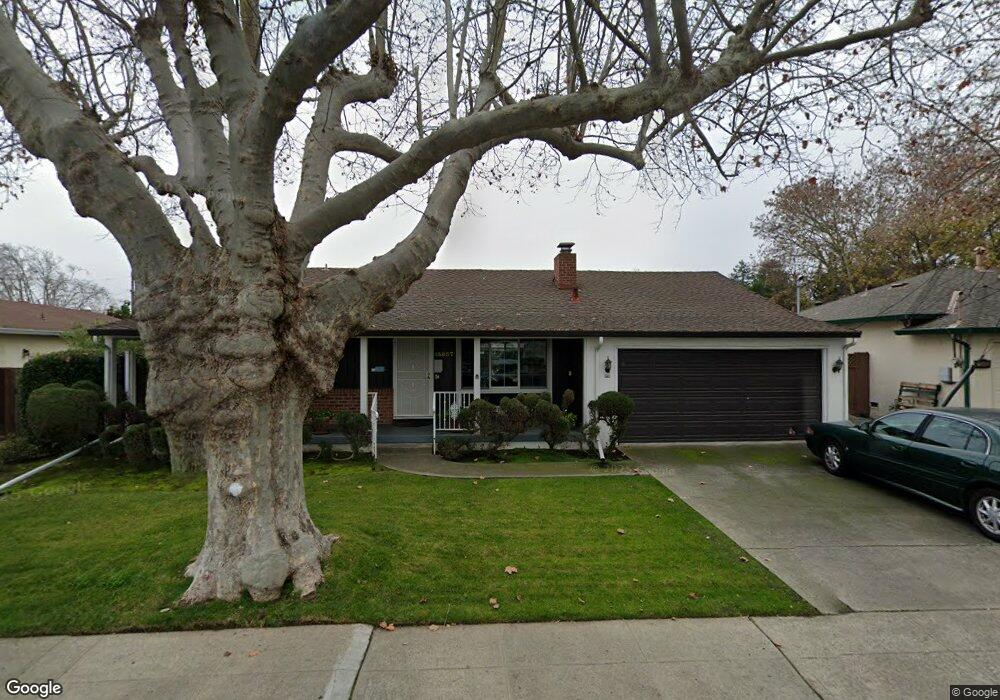
15857 Via Granada San Lorenzo, CA 94580
Estimated Value: $819,000 - $874,000
3
Beds
2
Baths
1,468
Sq Ft
$576/Sq Ft
Est. Value
About This Home
This home is located at 15857 Via Granada, San Lorenzo, CA 94580 and is currently estimated at $845,983, approximately $576 per square foot. 15857 Via Granada is a home located in Alameda County with nearby schools including Grant Elementary School, Washington Manor Middle School, and San Lorenzo High School.
Ownership History
Date
Name
Owned For
Owner Type
Purchase Details
Closed on
May 3, 2000
Sold by
Savage Thomas F and Savage Dorothy J
Bought by
Savage Thomas F and Savage Dorothy Juanita
Current Estimated Value
Purchase Details
Closed on
Jun 19, 1996
Sold by
Hutchins A Mark and The Jane B Hutchins Trust
Bought by
Savage Thomas F and Savage Dorothy J
Home Financials for this Owner
Home Financials are based on the most recent Mortgage that was taken out on this home.
Original Mortgage
$152,800
Outstanding Balance
$9,985
Interest Rate
8.25%
Estimated Equity
$835,998
Purchase Details
Closed on
Mar 19, 1996
Sold by
Hutchins A Mark and Jane B Hutchins Trust
Bought by
Hutchins A Mark
Create a Home Valuation Report for This Property
The Home Valuation Report is an in-depth analysis detailing your home's value as well as a comparison with similar homes in the area
Home Values in the Area
Average Home Value in this Area
Purchase History
| Date | Buyer | Sale Price | Title Company |
|---|---|---|---|
| Savage Thomas F | -- | -- | |
| Savage Thomas F | $191,000 | North American Title Co | |
| Hutchins A Mark | -- | -- |
Source: Public Records
Mortgage History
| Date | Status | Borrower | Loan Amount |
|---|---|---|---|
| Open | Savage Thomas F | $152,800 |
Source: Public Records
Tax History Compared to Growth
Tax History
| Year | Tax Paid | Tax Assessment Tax Assessment Total Assessment is a certain percentage of the fair market value that is determined by local assessors to be the total taxable value of land and additions on the property. | Land | Improvement |
|---|---|---|---|---|
| 2025 | $10,014 | $792,311 | $274,470 | $524,841 |
| 2024 | $10,014 | $776,639 | $269,088 | $514,551 |
| 2023 | $4,296 | $304,961 | $91,488 | $213,473 |
| 2022 | $4,220 | $291,983 | $89,695 | $209,288 |
| 2021 | $4,096 | $286,121 | $87,936 | $205,185 |
| 2020 | $3,997 | $290,117 | $87,035 | $203,082 |
| 2019 | $3,992 | $284,428 | $85,328 | $199,100 |
| 2018 | $3,831 | $278,853 | $83,656 | $195,197 |
| 2017 | $3,658 | $273,387 | $82,016 | $191,371 |
| 2016 | $3,487 | $268,027 | $80,408 | $187,619 |
| 2015 | $3,409 | $264,003 | $79,201 | $184,802 |
| 2014 | $3,358 | $258,833 | $77,650 | $181,183 |
Source: Public Records
Map
Nearby Homes
- 15958 Via Descanso
- 15609 Ronda St
- 15867 Hesperian Blvd
- 181 E Lewelling Blvd
- 179 Loma Verde Dr
- 15539 Usher St
- 15540 Hesperian Blvd
- 17779 Rainier Ave
- 638 Paseo Del Rio
- 263 Ano Ave
- 16829 Daryl Ave
- 17754 Meekland Ave Unit 1
- 16011 Via Conejo
- 16960 Westerman Ct
- 920 Elgin St Unit G
- 16050 Via Olinda
- 0 E 14th St Unit 41059501
- 17347 Via Encinas
- 18905 Standish Ave
- 17316 Via Flores
- 15865 Via Granada
- 15849 Via Granada
- 15812 Via Rivera
- 15808 Via Rivera
- 15816 Via Rivera
- 15873 Via Granada
- 15804 Via Rivera
- 230 Peach Dr
- 15813 Via Marlin
- 15820 Via Rivera
- 246 Peach Dr
- 15836 Via Granada
- 15881 Via Granada
- 15824 Via Rivera
- 15874 Via Granada
- 15800 Via Rivera
- 15814 Via Marlin
- 15816 Via Marlin
- 15821 Via Marlin
- 15828 Via Granada