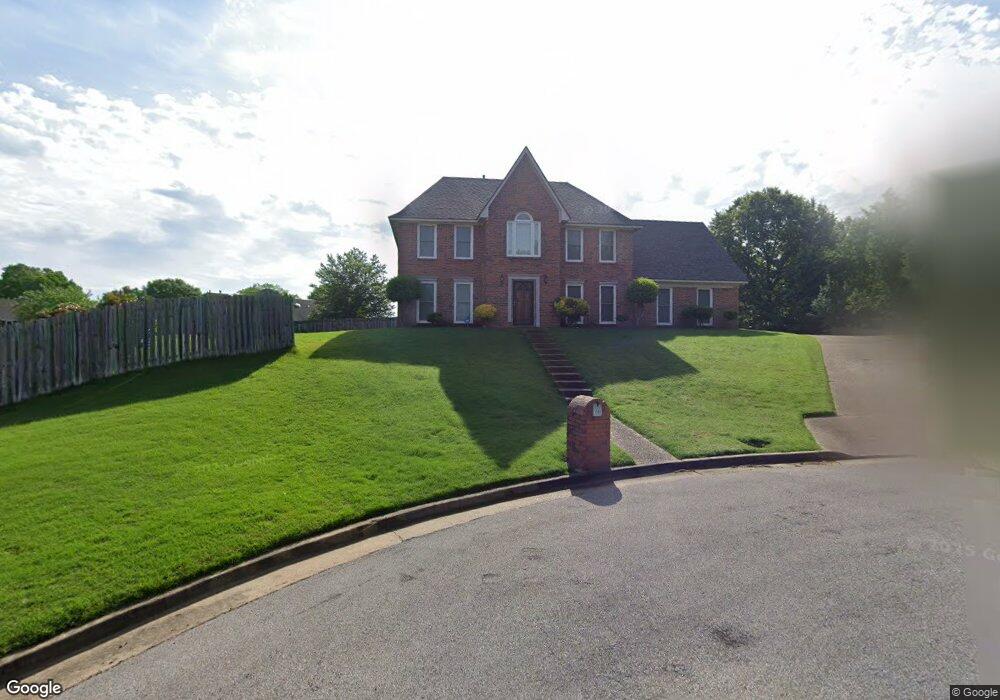
1586 Nesting Dove Cove Cordova, TN 38016
Cordova NeighborhoodEstimated Value: $321,977 - $352,000
4
Beds
3
Baths
2,944
Sq Ft
$113/Sq Ft
Est. Value
About This Home
This home is located at 1586 Nesting Dove Cove, Cordova, TN 38016 and is currently estimated at $332,744, approximately $113 per square foot. 1586 Nesting Dove Cove is a home located in Shelby County with nearby schools including Riverwood Elementary School, Cordova High School, and Cordova Middle School.
Ownership History
Date
Name
Owned For
Owner Type
Purchase Details
Closed on
Nov 24, 2025
Sold by
Hunt Katherine W and Hunt Evan Robertson
Bought by
Hunt Katherine W
Current Estimated Value
Purchase Details
Closed on
Jul 13, 2009
Sold by
Vandoanh and Van Thuy Mai
Bought by
Hunt Katherine W
Home Financials for this Owner
Home Financials are based on the most recent Mortgage that was taken out on this home.
Original Mortgage
$152,192
Interest Rate
5.27%
Mortgage Type
FHA
Purchase Details
Closed on
Jul 20, 2005
Sold by
Mo Jiada and Zheng Yanming
Bought by
Vandoanh
Home Financials for this Owner
Home Financials are based on the most recent Mortgage that was taken out on this home.
Original Mortgage
$101,000
Interest Rate
5.59%
Mortgage Type
Purchase Money Mortgage
Create a Home Valuation Report for This Property
The Home Valuation Report is an in-depth analysis detailing your home's value as well as a comparison with similar homes in the area
Home Values in the Area
Average Home Value in this Area
Purchase History
| Date | Buyer | Sale Price | Title Company |
|---|---|---|---|
| Hunt Katherine W | -- | Mid South Title Services | |
| Hunt Katherine W | $155,000 | Home Surety Title & Escrow L | |
| Vandoanh | $173,000 | Realty Title |
Source: Public Records
Mortgage History
| Date | Status | Borrower | Loan Amount |
|---|---|---|---|
| Previous Owner | Hunt Katherine W | $152,192 | |
| Previous Owner | Vandoanh | $101,000 |
Source: Public Records
Tax History Compared to Growth
Tax History
| Year | Tax Paid | Tax Assessment Tax Assessment Total Assessment is a certain percentage of the fair market value that is determined by local assessors to be the total taxable value of land and additions on the property. | Land | Improvement |
|---|---|---|---|---|
| 2025 | $1,979 | $79,100 | $16,450 | $62,650 |
| 2024 | $1,979 | $58,375 | $10,450 | $47,925 |
| 2023 | $3,556 | $58,375 | $10,450 | $47,925 |
| 2022 | $3,556 | $58,375 | $10,450 | $47,925 |
| 2021 | $3,598 | $58,375 | $10,450 | $47,925 |
| 2020 | $3,065 | $42,300 | $10,450 | $31,850 |
| 2019 | $3,065 | $42,300 | $10,450 | $31,850 |
| 2018 | $3,065 | $42,300 | $10,450 | $31,850 |
| 2017 | $1,739 | $42,300 | $10,450 | $31,850 |
| 2016 | $1,619 | $37,050 | $0 | $0 |
| 2014 | $1,619 | $37,050 | $0 | $0 |
Source: Public Records
Map
Nearby Homes
- 1592 W Southfield Cir Unit 52
- 1466 Fox Trace Dr
- 7770 Juniper Cove E
- 7693 Killdeer Ln
- 7646 Dexter Run Cir
- 1655 S Ryamar Cove
- 1785 Candle Ridge Dr
- 1311 Fox Trace Dr
- 1520 Cider House Ln
- 1595 Dexter Grove Ct Unit E105
- 1595 Dexter Grove Ct Unit D101
- 2288 Germantown Dr
- 7999 Club Center Dr
- 1895 Wood Oak Dr
- 7520 Crystal Lake Dr
- 1321 Winter Springs Ln
- 7426 Lost Trail Dr
- 1840 Woodchase Glen Dr
- 7410 Appling Rain Dr
- 7407 Lost Grove Ln
- 1582 Nesting Dove Cove
- 1601 Wren Hollow Cove
- 7743 Nesting Dove Ln
- 7749 Nesting Dove Ln
- 1596 Wren Hollow Cove
- 1581 Nesting Dove Cove
- 7772 Widgeon Lake Cove
- 7764 Widgeon Lake Cove
- 7755 Nesting Dove Ln
- 7776 Widgeon Lake Cove
- 7731 Nesting Dove Ln
- 1590 Lacewing Trace Ln
- 1600 Lacewing Trace Ln
- 1599 Wren Hollow Cove
- 7756 Widgeon Lake Cove
- 7723 Nesting Dove Ln
- 7782 Widgeon Lake Cove
- 7740 Nesting Dove Ln
- 7746 Nesting Dove Ln
- 7734 Nesting Dove Ln