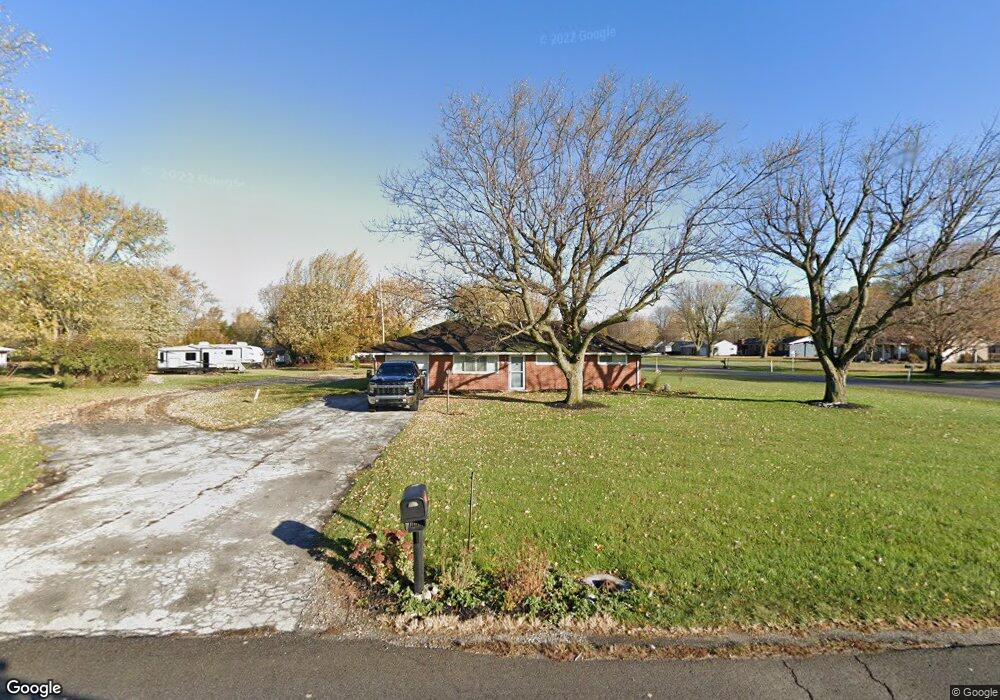
15867 Ohio 309 Kenton, OH 43326
Estimated Value: $185,301 - $214,000
3
Beds
2
Baths
1,112
Sq Ft
$179/Sq Ft
Est. Value
About This Home
This home is located at 15867 Ohio 309, Kenton, OH 43326 and is currently estimated at $199,575, approximately $179 per square foot. 15867 Ohio 309 is a home located in Hardin County with nearby schools including Kenton Elementary School, Kenton Middle School, and Kenton High School.
Ownership History
Date
Name
Owned For
Owner Type
Purchase Details
Closed on
Aug 24, 2018
Sold by
Hommel Chase and Hommel Abby
Bought by
Striblen Amanda
Current Estimated Value
Home Financials for this Owner
Home Financials are based on the most recent Mortgage that was taken out on this home.
Original Mortgage
$117,826
Outstanding Balance
$104,459
Interest Rate
5.5%
Mortgage Type
FHA
Estimated Equity
$95,116
Purchase Details
Closed on
Sep 28, 2012
Sold by
Mcclaren Thomas D
Bought by
Hommel Chase and Hommel Abby
Home Financials for this Owner
Home Financials are based on the most recent Mortgage that was taken out on this home.
Original Mortgage
$80,000
Interest Rate
3.57%
Mortgage Type
Future Advance Clause Open End Mortgage
Purchase Details
Closed on
Jan 29, 1998
Bought by
Elsasser Theodore L
Create a Home Valuation Report for This Property
The Home Valuation Report is an in-depth analysis detailing your home's value as well as a comparison with similar homes in the area
Home Values in the Area
Average Home Value in this Area
Purchase History
| Date | Buyer | Sale Price | Title Company |
|---|---|---|---|
| Striblen Amanda | $120,000 | First American Mortgage Solu | |
| Hommel Chase | $60,000 | None Available | |
| Elsasser Theodore L | -- | -- |
Source: Public Records
Mortgage History
| Date | Status | Borrower | Loan Amount |
|---|---|---|---|
| Open | Striblen Amanda | $117,826 | |
| Previous Owner | Hommel Chase | $80,000 |
Source: Public Records
Tax History Compared to Growth
Tax History
| Year | Tax Paid | Tax Assessment Tax Assessment Total Assessment is a certain percentage of the fair market value that is determined by local assessors to be the total taxable value of land and additions on the property. | Land | Improvement |
|---|---|---|---|---|
| 2024 | $2,145 | $50,700 | $17,400 | $33,300 |
| 2023 | $2,145 | $50,700 | $17,400 | $33,300 |
| 2022 | $1,626 | $35,600 | $12,780 | $22,820 |
| 2021 | $1,632 | $35,600 | $12,780 | $22,820 |
| 2020 | $1,412 | $35,600 | $12,780 | $22,820 |
| 2019 | $1,187 | $31,070 | $12,170 | $18,900 |
| 2018 | $1,185 | $31,070 | $12,170 | $18,900 |
| 2017 | $1,165 | $31,070 | $12,170 | $18,900 |
| 2016 | $1,123 | $31,510 | $11,170 | $20,340 |
| 2015 | $1,099 | $31,510 | $11,170 | $20,340 |
| 2014 | $1,122 | $31,510 | $11,170 | $20,340 |
| 2013 | $1,244 | $33,410 | $11,170 | $22,240 |
Source: Public Records
Map
Nearby Homes
- 11896 Parklane Dr
- 920 Cooper St
- 1 C Ct
- 115 Scioto St
- 79 Broadway St
- 39 Grape St
- 530 E Franklin St
- 513 E Franklin St
- 324 Stone Hedge Ln Unit 324
- 510 Decatur St
- 509 E Carrol St
- 508 Decatur St
- 104 Oak Ln Unit 15
- 121 S High St
- 0 N Barron St
- 503 Jennings St
- 0 Gilmore St
- 777 Maydoll Dr
- 416 E Eliza St
- 639 S Main St
- 15867 State Route 309
- 11960 Parklane Dr
- 15827 State Route 309
- 11960 Park Lane Dr
- 11913 Parklane Dr
- 15921 State Route 309
- 11936 Parklane Dr
- 15921 Ohio 309
- 11976 Hillcrest Dr
- 11914 Park Lane Dr
- 11914 Parklane Dr
- 11914 Parklane Dr
- 15941 State Route 309
- 11926 Hillcrest Dr
- 11975 Hillcrest Dr
- 11908 Hillcrest Dr
- 11977 County Road 175