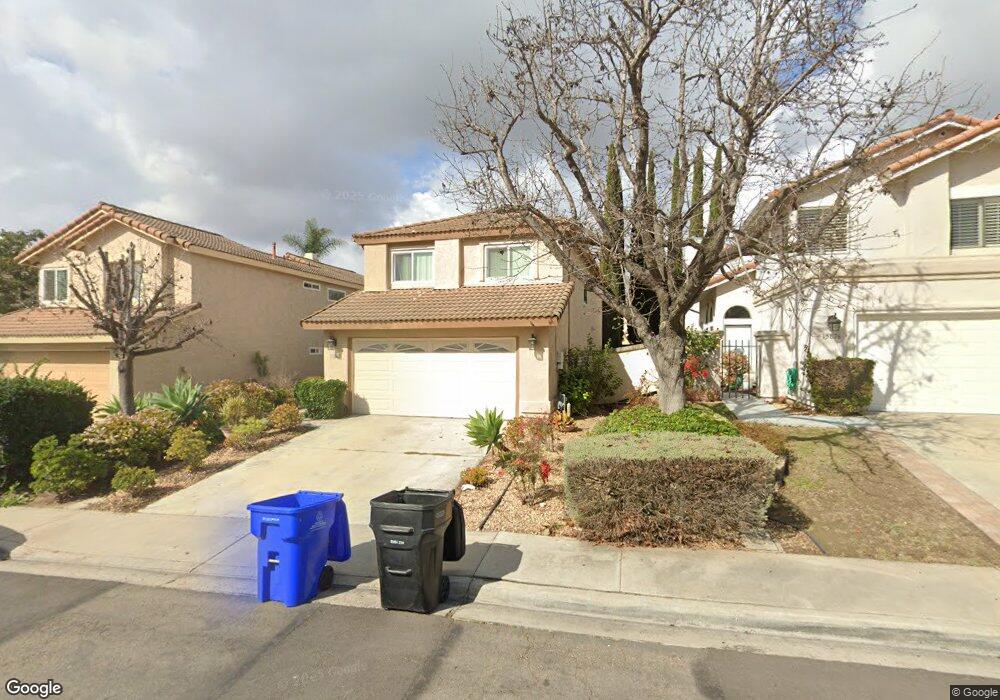
15868 Windrose Way San Diego, CA 92127
Rancho Bernardo NeighborhoodEstimated Value: $1,017,053 - $1,252,000
3
Beds
3
Baths
1,638
Sq Ft
$713/Sq Ft
Est. Value
About This Home
This home is located at 15868 Windrose Way, San Diego, CA 92127 and is currently estimated at $1,168,013, approximately $713 per square foot. 15868 Windrose Way is a home located in San Diego County with nearby schools including Turtleback Elementary, Bernardo Heights Middle, and Rancho Bernardo High.
Ownership History
Date
Name
Owned For
Owner Type
Purchase Details
Closed on
Mar 18, 2015
Sold by
Kim Do S and Kim Chong M
Bought by
Kim Revocable Living Trust
Current Estimated Value
Purchase Details
Closed on
Feb 5, 2003
Sold by
Mccutchen Suzan Diane
Bought by
Kim Do S and Kim Chong M
Home Financials for this Owner
Home Financials are based on the most recent Mortgage that was taken out on this home.
Original Mortgage
$280,000
Outstanding Balance
$119,392
Interest Rate
5.89%
Estimated Equity
$1,048,621
Purchase Details
Closed on
Jan 12, 2000
Sold by
Mccutchen Suzan D
Bought by
Mccutchen Suzan Diane
Home Financials for this Owner
Home Financials are based on the most recent Mortgage that was taken out on this home.
Original Mortgage
$237,000
Interest Rate
7.84%
Purchase Details
Closed on
Feb 21, 1996
Sold by
Mccutchen John R
Bought by
Mccutchen Suzan Diane
Purchase Details
Closed on
Nov 13, 1991
Purchase Details
Closed on
Jun 27, 1985
Create a Home Valuation Report for This Property
The Home Valuation Report is an in-depth analysis detailing your home's value as well as a comparison with similar homes in the area
Home Values in the Area
Average Home Value in this Area
Purchase History
| Date | Buyer | Sale Price | Title Company |
|---|---|---|---|
| Kim Revocable Living Trust | -- | None Available | |
| Kim Do S | $400,000 | Fidelity National Title Co | |
| Mccutchen Suzan Diane | -- | First American Title Ins Co | |
| Mccutchen Suzan Diane | -- | -- | |
| -- | $213,500 | -- | |
| -- | $125,000 | -- |
Source: Public Records
Mortgage History
| Date | Status | Borrower | Loan Amount |
|---|---|---|---|
| Open | Kim Do S | $280,000 | |
| Previous Owner | Mccutchen Suzan Diane | $237,000 |
Source: Public Records
Tax History Compared to Growth
Tax History
| Year | Tax Paid | Tax Assessment Tax Assessment Total Assessment is a certain percentage of the fair market value that is determined by local assessors to be the total taxable value of land and additions on the property. | Land | Improvement |
|---|---|---|---|---|
| 2025 | $6,371 | $579,314 | $231,726 | $347,588 |
| 2024 | $6,371 | $567,956 | $227,183 | $340,773 |
| 2023 | $6,234 | $556,821 | $222,729 | $334,092 |
| 2022 | $6,129 | $545,904 | $218,362 | $327,542 |
| 2021 | $6,048 | $535,201 | $214,081 | $321,120 |
| 2020 | $5,966 | $529,714 | $211,886 | $317,828 |
| 2019 | $5,810 | $519,329 | $207,732 | $311,597 |
| 2018 | $5,646 | $509,147 | $203,659 | $305,488 |
| 2017 | $5,494 | $499,165 | $199,666 | $299,499 |
| 2016 | $5,380 | $489,378 | $195,751 | $293,627 |
| 2015 | $5,299 | $482,028 | $192,811 | $289,217 |
| 2014 | $5,173 | $472,587 | $189,035 | $283,552 |
Source: Public Records
Map
Nearby Homes
- 15273 Maturin Dr Unit 40
- 15283 Maturin Dr Unit 62
- 15373 Maturin Dr Unit 178
- 11251 Avenida de Los Lobos Unit D
- 11239 Avenida de Los Lobos Unit D
- 15865 Lofty Trail Dr Unit 313-372-24-00
- 15985 Camino Crisalida Unit 5
- 16096 Caminito Tomas
- 11781 Caminito de Las Missiones
- 11705 Via Medanos
- 15576 Paseo Ajanta
- 15589 Paseo Jenghiz
- 10832 Avenida de Los Lobos
- 15541 Paseo Jenghiz
- 15547 Paseo Jenghiz
- 15363 Falcon Crest Ct
- 16244 Avenida Venusto Unit A
- 16232 Avenida Venusto Unit B
- 11385 Paseo Albacete
- 11378 Ajanta Ct
- 15860 Windrose Way
- 15876 Windrose Way
- 15852 Windrose Way
- 15884 Windrose Way
- 15863 Sunnyfield Place
- 15871 Sunnyfield Place
- 15857 Sunnyfield Place
- 15879 Sunnyfield Place
- 15846 Windrose Way
- 15851 Sunnyfield Place
- 15890 Windrose Way
- 15887 Sunnyfield Place
- 15883 Windrose Way
- 15845 Sunnyfield Place
- 15875 Windrose Way
- 15891 Windrose Way
- 15840 Windrose Way
- 15897 Windrose Way
- 15895 Sunnyfield Place
- 15839 Sunnyfield Place