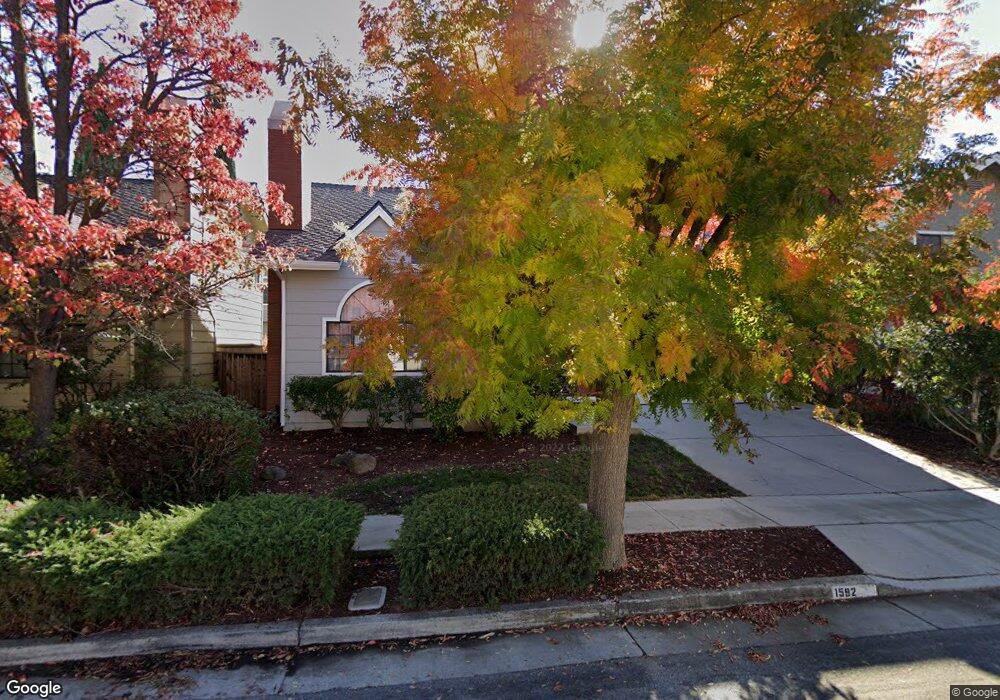
1587 Camden Village Cir San Jose, CA 95124
Dartmouth NeighborhoodEstimated Value: $1,181,000 - $1,585,000
3
Beds
3
Baths
1,539
Sq Ft
$884/Sq Ft
Est. Value
About This Home
This home is located at 1587 Camden Village Cir, San Jose, CA 95124 and is currently estimated at $1,360,916, approximately $884 per square foot. 1587 Camden Village Cir is a home located in Santa Clara County with nearby schools including Guadalupe Elementary School, Dartmouth Middle School, and Leigh High School.
Ownership History
Date
Name
Owned For
Owner Type
Purchase Details
Closed on
Sep 1, 2022
Sold by
Peruzzi and Monica
Bought by
Peruzzi Family Living Trust
Current Estimated Value
Purchase Details
Closed on
Feb 18, 2005
Sold by
Bryla Ed and Bryla Marsha Joy
Bought by
Peruzzi Guido and Serrano Peruzzi Monica
Home Financials for this Owner
Home Financials are based on the most recent Mortgage that was taken out on this home.
Original Mortgage
$359,650
Interest Rate
5.25%
Mortgage Type
Purchase Money Mortgage
Purchase Details
Closed on
Jul 29, 1997
Sold by
Osten Martin K
Bought by
Bryla Ed and Bryla Marsha Joy
Home Financials for this Owner
Home Financials are based on the most recent Mortgage that was taken out on this home.
Original Mortgage
$245,800
Interest Rate
5.37%
Mortgage Type
Purchase Money Mortgage
Create a Home Valuation Report for This Property
The Home Valuation Report is an in-depth analysis detailing your home's value as well as a comparison with similar homes in the area
Home Values in the Area
Average Home Value in this Area
Purchase History
| Date | Buyer | Sale Price | Title Company |
|---|---|---|---|
| Peruzzi Family Living Trust | -- | -- | |
| Peruzzi Guido | $563,000 | First American Title Company | |
| Bryla Ed | $259,000 | Santa Clara Land Title Co |
Source: Public Records
Mortgage History
| Date | Status | Borrower | Loan Amount |
|---|---|---|---|
| Previous Owner | Peruzzi Guido | $359,650 | |
| Previous Owner | Bryla Ed | $245,800 | |
| Closed | Peruzzi Guido | $90,350 |
Source: Public Records
Tax History Compared to Growth
Tax History
| Year | Tax Paid | Tax Assessment Tax Assessment Total Assessment is a certain percentage of the fair market value that is determined by local assessors to be the total taxable value of land and additions on the property. | Land | Improvement |
|---|---|---|---|---|
| 2025 | $11,926 | $784,404 | $352,929 | $431,475 |
| 2024 | $11,926 | $769,024 | $346,009 | $423,015 |
| 2023 | $11,663 | $753,946 | $339,225 | $414,721 |
| 2022 | $11,333 | $739,164 | $332,574 | $406,590 |
| 2021 | $11,065 | $724,671 | $326,053 | $398,618 |
| 2020 | $10,755 | $717,241 | $322,710 | $394,531 |
| 2019 | $10,529 | $703,179 | $316,383 | $386,796 |
| 2018 | $10,257 | $689,392 | $310,180 | $379,212 |
| 2017 | $10,115 | $675,876 | $304,099 | $371,777 |
| 2016 | $9,646 | $662,625 | $298,137 | $364,488 |
| 2015 | $9,564 | $652,673 | $293,659 | $359,014 |
| 2014 | $8,495 | $635,000 | $285,700 | $349,300 |
Source: Public Records
Map
Nearby Homes
- 1563 Dorcey Ln
- 1683 Zinnia Ln
- 5633 Drysdale Dr
- 1504 Foster Ct
- 1705 Blossom Hill Rd
- 5743 Begonia Dr
- 102 Belvale Dr
- 103 Belridge Dr
- 118 Belridge Dr
- 1432 Montelegre Dr
- 5892 Burchell Ave
- 0000 Harwood Rd
- 1423 Dot Ct
- 1543 Rose Anna Dr
- 1796 Chevalier Dr
- 5701 Waltrip Ln
- 5602 Meridian Ave
- 5066 Carter Ave
- 14510 Blossom Hill Rd
- 1284 Mokelumne Place
- 1589 Camden Village Cir
- 1585 Camden Village Cir
- 1592 Camden Oaks Ct
- 1591 Camden Village Cir
- 1594 Camden Oaks Ct
- 1583 Camden Village Cir
- 1593 Camden Village Cir Unit 54
- 1590 Camden Oaks Ct
- 1581 Camden Village Cir
- 1596 Camden Oaks Ct
- 1588 Camden Village Cir
- 1595 Camden Village Cir
- 1586 Camden Village Cir
- 1500 Camden Oaks Ct
- 1588 Camden Oaks Ct
- 1597 Camden Village Cir
- 1584 Camden Village Cir
- 1579 Camden Village Cir
- 1590 Camden Village Cir
- 1582 Camden Village Cir