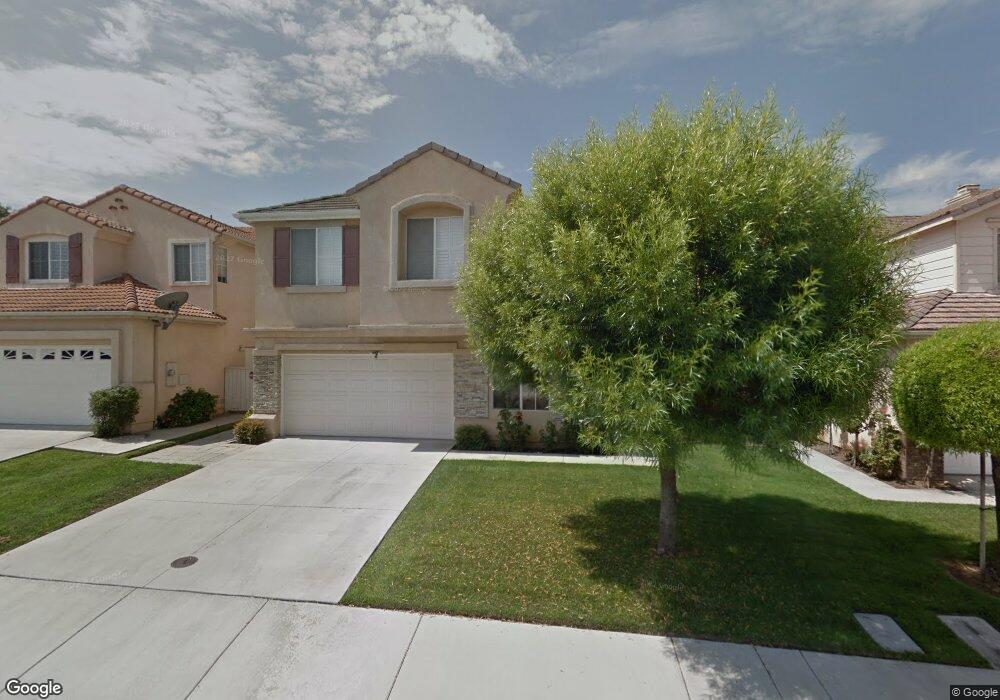
15878 Silver Springs Dr Chino Hills, CA 91709
Los Serranos NeighborhoodEstimated Value: $1,029,185 - $1,161,000
3
Beds
3
Baths
2,162
Sq Ft
$496/Sq Ft
Est. Value
About This Home
This home is located at 15878 Silver Springs Dr, Chino Hills, CA 91709 and is currently estimated at $1,072,296, approximately $495 per square foot. 15878 Silver Springs Dr is a home located in San Bernardino County with nearby schools including Chaparral Elementary School, Robert O. Townsend Junior High School, and Chino Hills High School.
Ownership History
Date
Name
Owned For
Owner Type
Purchase Details
Closed on
Oct 26, 2018
Sold by
Li Erin
Bought by
15878 Silver Llc
Current Estimated Value
Purchase Details
Closed on
May 11, 2018
Sold by
Li Erin
Bought by
Li Erin
Purchase Details
Closed on
Nov 9, 2004
Sold by
Miclat Lee Jason D
Bought by
Li Lifeng
Home Financials for this Owner
Home Financials are based on the most recent Mortgage that was taken out on this home.
Original Mortgage
$330,000
Interest Rate
5.7%
Mortgage Type
Purchase Money Mortgage
Purchase Details
Closed on
Nov 26, 1999
Sold by
Lennar Homes Of California Inc
Bought by
Miclat Lee Jason D and Miclat Lee Lorianne
Home Financials for this Owner
Home Financials are based on the most recent Mortgage that was taken out on this home.
Original Mortgage
$220,000
Interest Rate
7.68%
Create a Home Valuation Report for This Property
The Home Valuation Report is an in-depth analysis detailing your home's value as well as a comparison with similar homes in the area
Home Values in the Area
Average Home Value in this Area
Purchase History
| Date | Buyer | Sale Price | Title Company |
|---|---|---|---|
| 15878 Silver Llc | -- | None Available | |
| Li Erin | -- | None Available | |
| Li Lifeng | $553,000 | Lawyers Title Company | |
| Miclat Lee Jason D | $275,500 | Chicago Title |
Source: Public Records
Mortgage History
| Date | Status | Borrower | Loan Amount |
|---|---|---|---|
| Previous Owner | Li Lifeng | $330,000 | |
| Previous Owner | Miclat Lee Jason D | $220,000 | |
| Closed | Miclat Lee Jason D | $41,200 |
Source: Public Records
Tax History Compared to Growth
Tax History
| Year | Tax Paid | Tax Assessment Tax Assessment Total Assessment is a certain percentage of the fair market value that is determined by local assessors to be the total taxable value of land and additions on the property. | Land | Improvement |
|---|---|---|---|---|
| 2025 | $9,846 | $739,589 | $256,569 | $483,020 |
| 2024 | $9,846 | $725,087 | $251,538 | $473,549 |
| 2023 | $9,589 | $710,870 | $246,606 | $464,264 |
| 2022 | $9,507 | $696,932 | $241,771 | $455,161 |
| 2021 | $9,322 | $683,266 | $237,030 | $446,236 |
| 2020 | $9,190 | $676,260 | $234,600 | $441,660 |
| 2019 | $9,025 | $663,000 | $230,000 | $433,000 |
| 2018 | $8,840 | $650,900 | $227,900 | $423,000 |
| 2017 | $8,414 | $614,100 | $215,000 | $399,100 |
| 2016 | $7,754 | $584,900 | $204,800 | $380,100 |
| 2015 | $7,399 | $557,000 | $195,000 | $362,000 |
| 2014 | $7,000 | $522,000 | $183,000 | $339,000 |
Source: Public Records
Map
Nearby Homes
- 15892 Tanberry Dr
- 15849 Tanberry Dr
- 15906 Kingston Rd
- 15946 Ellington Way
- 15920 Ellington Way
- 15841 Ellington Way
- 5165 Pomona Rincon Rd
- 5177 Pomona Rincon Rd
- 0 Pomona Rincon Rd Unit TR19286701
- 15508 Quail St
- 4570 Willow Bend Ct
- 5142 Cellini Dr
- 4718 El Molino Ln
- 15597 Timberidge Ln
- 4479 Saint Andrews Dr
- 5521 Stargaze St
- 4441 Los Serranos Blvd
- 15366 Carmelita Ave
- 16349 Misty Hill Dr
- 15239 Murray Ave
- 15872 Silver Springs Dr
- 15884 Silver Springs Dr
- 15866 Silver Springs Dr
- 15860 Silver Springs Dr
- 15875 Silver Springs Dr
- 15869 Silver Springs Dr
- 15881 Silver Springs Dr
- 15902 Silver Springs Dr
- 15863 Silver Springs Dr
- 15854 Silver Springs Dr
- 15887 Silver Springs Dr
- 15905 Tanberry Dr
- 15913 Tanberry Dr
- 15897 Tanberry Dr
- 15857 Silver Springs Dr
- 15893 Silver Springs Dr
- 15908 Silver Springs Dr
- 15889 Tanberry Dr
- 15848 Silver Springs Dr
- 15888 Madelyn Ct