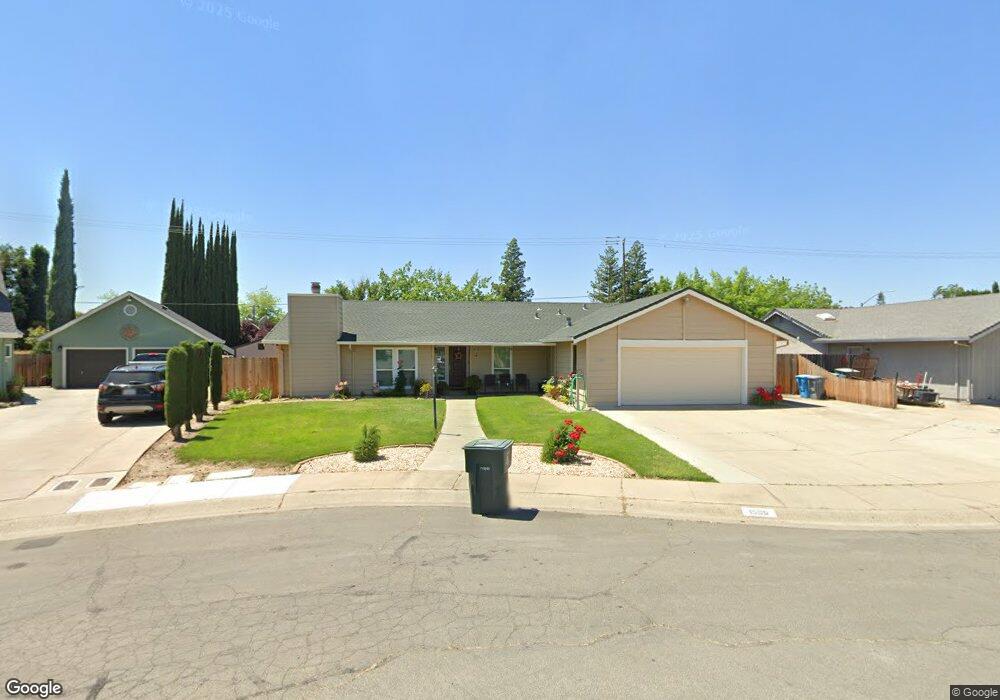
1588 Camino Del Oro Yuba City, CA 95993
Estimated Value: $345,000 - $437,000
3
Beds
2
Baths
1,578
Sq Ft
$255/Sq Ft
Est. Value
About This Home
This home is located at 1588 Camino Del Oro, Yuba City, CA 95993 and is currently estimated at $402,578, approximately $255 per square foot. 1588 Camino Del Oro is a home located in Sutter County with nearby schools including Andros Karperos, River Valley High School, and Adventist Christian School.
Ownership History
Date
Name
Owned For
Owner Type
Purchase Details
Closed on
Jun 21, 2019
Sold by
Singh Jaspal and Kaur Amandeep
Bought by
Singh Jaspal and Kaur Amandeep
Current Estimated Value
Purchase Details
Closed on
Jul 26, 2004
Sold by
Singh Sukhninder
Bought by
Singh Jaspal and Kaur Amandeep
Purchase Details
Closed on
Jan 4, 2000
Sold by
Kaur Jaswant
Bought by
Singh Sukhninder
Home Financials for this Owner
Home Financials are based on the most recent Mortgage that was taken out on this home.
Original Mortgage
$68,500
Interest Rate
7.68%
Purchase Details
Closed on
Jan 3, 2000
Sold by
Horton Robert H and Horton Joy R
Bought by
Singh Sukhninder and Singh Hargit
Home Financials for this Owner
Home Financials are based on the most recent Mortgage that was taken out on this home.
Original Mortgage
$68,500
Interest Rate
7.68%
Create a Home Valuation Report for This Property
The Home Valuation Report is an in-depth analysis detailing your home's value as well as a comparison with similar homes in the area
Home Values in the Area
Average Home Value in this Area
Purchase History
| Date | Buyer | Sale Price | Title Company |
|---|---|---|---|
| Singh Jaspal | -- | None Available | |
| Singh Jaspal | $35,000 | North State Title Company | |
| Singh Sukhninder | -- | North State Title Company | |
| Singh Sukhninder | $108,500 | North State Title Company |
Source: Public Records
Mortgage History
| Date | Status | Borrower | Loan Amount |
|---|---|---|---|
| Previous Owner | Singh Sukhninder | $68,500 |
Source: Public Records
Tax History Compared to Growth
Tax History
| Year | Tax Paid | Tax Assessment Tax Assessment Total Assessment is a certain percentage of the fair market value that is determined by local assessors to be the total taxable value of land and additions on the property. | Land | Improvement |
|---|---|---|---|---|
| 2025 | $2,525 | $220,326 | $56,546 | $163,780 |
| 2024 | $2,525 | $216,007 | $55,438 | $160,569 |
| 2023 | $2,525 | $211,772 | $54,351 | $157,421 |
| 2022 | $2,431 | $207,621 | $53,286 | $154,335 |
| 2021 | $2,405 | $203,579 | $52,260 | $151,319 |
| 2020 | $2,363 | $201,492 | $51,724 | $149,768 |
| 2019 | $2,313 | $197,541 | $50,710 | $146,831 |
| 2018 | $2,280 | $193,667 | $49,715 | $143,952 |
| 2017 | $2,226 | $189,870 | $48,741 | $141,129 |
| 2016 | $2,183 | $186,147 | $47,785 | $138,362 |
| 2015 | $2,148 | $183,351 | $47,067 | $136,284 |
| 2014 | $1,958 | $158,000 | $35,000 | $123,000 |
Source: Public Records
Map
Nearby Homes
- 1571 Holly Tree Dr
- 1545 Camino Del Oro
- 1665 Michelle Dr
- 1514 Countryside Dr
- 170 Nantucket Way
- 238 Anita Way
- 138 Nantucket Way
- 152 College Hill Way
- 156 Bristol Way
- 1781 Franklin Rd Unit 36
- 1781 Franklin Rd Unit 59
- 1421 Richland Rd
- 430 Neil Dr
- 1344 Kean Ave
- 1955 Jason Ct
- 1330 Kean Ave
- 1196 Hunn Rd
- 1923 Hardial Dr
- 285 S Barrett Rd
- 1132 Marcia Ave
- 1590 Camino Del Oro
- 1586 Camino Del Oro
- 1584 Camino Del Oro
- 1581 Camino Del Oro
- 1594 Camino Del Oro
- 1578 Camino Del Oro
- 1595 Holly Tree Dr Unit 2
- 1586 Camino de Flores
- 1575 Camino Del Oro
- 1587 Holly Tree Dr
- 1572 Camino Del Oro
- 1580 Camino de Flores
- 341 S Walton Ave
- 1569 Camino Del Oro
- 262 S Walton Ave
- 1579 Holly Tree Dr
- 1574 Camino de Flores
- 1566 Camino Del Oro
- 1583 Camino de Flores
- 1625 Camino de Flores