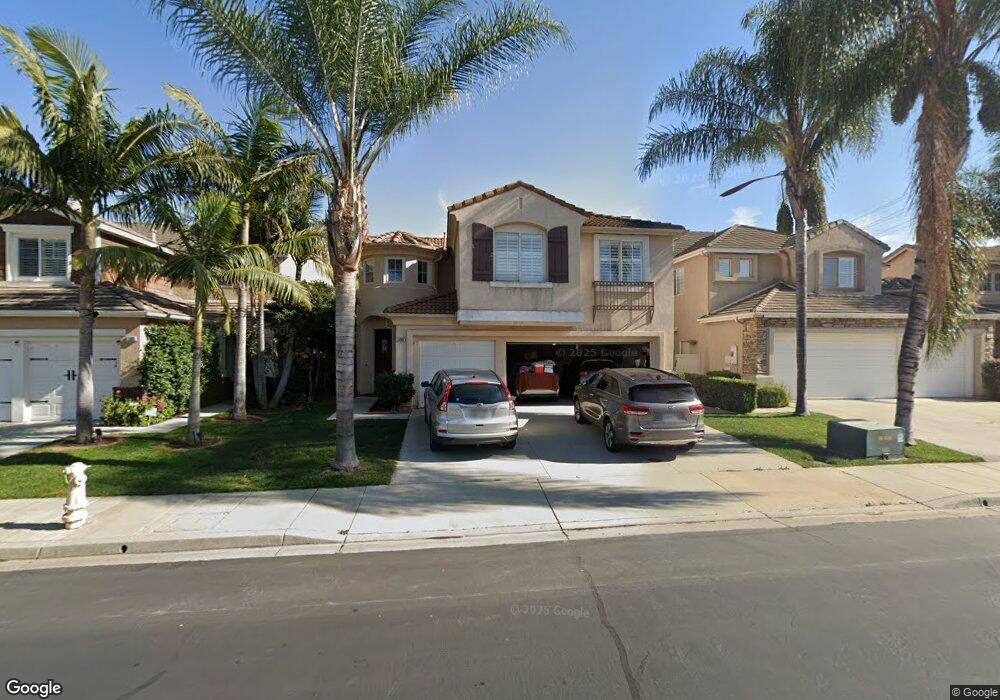
15889 Sedona Dr Chino Hills, CA 91709
Los Serranos NeighborhoodEstimated Value: $1,046,000 - $1,201,000
4
Beds
3
Baths
2,162
Sq Ft
$504/Sq Ft
Est. Value
About This Home
This home is located at 15889 Sedona Dr, Chino Hills, CA 91709 and is currently estimated at $1,089,653, approximately $504 per square foot. 15889 Sedona Dr is a home located in San Bernardino County with nearby schools including Chaparral Elementary School, Robert O. Townsend Junior High School, and Chino Hills High School.
Ownership History
Date
Name
Owned For
Owner Type
Purchase Details
Closed on
Apr 14, 2004
Sold by
Pedone Jim F
Bought by
Lin Yaochy
Current Estimated Value
Home Financials for this Owner
Home Financials are based on the most recent Mortgage that was taken out on this home.
Original Mortgage
$367,500
Outstanding Balance
$174,267
Interest Rate
5.77%
Mortgage Type
Stand Alone First
Estimated Equity
$915,386
Purchase Details
Closed on
Jan 28, 2000
Sold by
Pedone James F
Bought by
Pedone James F and Pedone Whitney D
Home Financials for this Owner
Home Financials are based on the most recent Mortgage that was taken out on this home.
Original Mortgage
$245,427
Interest Rate
7.1%
Purchase Details
Closed on
Sep 17, 1999
Sold by
Lennar Homes Of California Inc
Bought by
Pedone Jim F and Pedone Whitney D
Home Financials for this Owner
Home Financials are based on the most recent Mortgage that was taken out on this home.
Original Mortgage
$245,583
Interest Rate
6.5%
Create a Home Valuation Report for This Property
The Home Valuation Report is an in-depth analysis detailing your home's value as well as a comparison with similar homes in the area
Home Values in the Area
Average Home Value in this Area
Purchase History
| Date | Buyer | Sale Price | Title Company |
|---|---|---|---|
| Lin Yaochy | $525,000 | First American | |
| Pedone James F | -- | Chicago Title | |
| Pedone Jim F | $273,000 | Chicago Title |
Source: Public Records
Mortgage History
| Date | Status | Borrower | Loan Amount |
|---|---|---|---|
| Open | Lin Yaochy | $367,500 | |
| Previous Owner | Pedone James F | $245,427 | |
| Previous Owner | Pedone Jim F | $245,583 |
Source: Public Records
Tax History Compared to Growth
Tax History
| Year | Tax Paid | Tax Assessment Tax Assessment Total Assessment is a certain percentage of the fair market value that is determined by local assessors to be the total taxable value of land and additions on the property. | Land | Improvement |
|---|---|---|---|---|
| 2025 | $9,920 | $746,445 | $261,256 | $485,189 |
| 2024 | $9,920 | $731,808 | $256,133 | $475,675 |
| 2023 | $9,661 | $717,459 | $251,111 | $466,348 |
| 2022 | $9,579 | $703,391 | $246,187 | $457,204 |
| 2021 | $9,392 | $689,599 | $241,360 | $448,239 |
| 2020 | $9,259 | $682,528 | $238,885 | $443,643 |
| 2019 | $9,093 | $669,145 | $234,201 | $434,944 |
| 2018 | $8,897 | $656,025 | $229,609 | $426,416 |
| 2017 | $8,523 | $624,000 | $218,300 | $405,700 |
| 2016 | $7,853 | $594,300 | $207,900 | $386,400 |
| 2015 | $7,493 | $566,000 | $198,000 | $368,000 |
| 2014 | $7,031 | $525,000 | $184,000 | $341,000 |
Source: Public Records
Map
Nearby Homes
- 15906 Kingston Rd
- 15946 Ellington Way
- 15920 Ellington Way
- 15892 Tanberry Dr
- 15849 Tanberry Dr
- 15841 Ellington Way
- 5165 Pomona Rincon Rd
- 5177 Pomona Rincon Rd
- 0 Pomona Rincon Rd Unit TR19286701
- 15508 Quail St
- 5142 Cellini Dr
- 15597 Timberidge Ln
- 5521 Stargaze St
- 4570 Willow Bend Ct
- 4718 El Molino Ln
- 4479 Saint Andrews Dr
- 15366 Carmelita Ave
- 4441 Los Serranos Blvd
- 15239 Murray Ave
- 16349 Misty Hill Dr
- 15883 Sedona Dr
- 15895 Sedona Dr
- 15901 Sedona Dr
- 15894 Kingston Rd
- 15900 Kingston Rd
- 15888 Kingston Rd
- 15871 Sedona Dr
- 15907 Sedona Dr
- 15882 Kingston Rd
- 15880 Sedona Dr
- 15892 Sedona Dr
- 15912 Kingston Rd
- 15865 Sedona Dr
- 15874 Sedona Dr
- 15898 Sedona Dr
- 15876 Kingston Rd
- 15868 Sedona Dr
- 15859 Sedona Dr
- 15904 Sedona Dr
- 15870 Kingston Rd