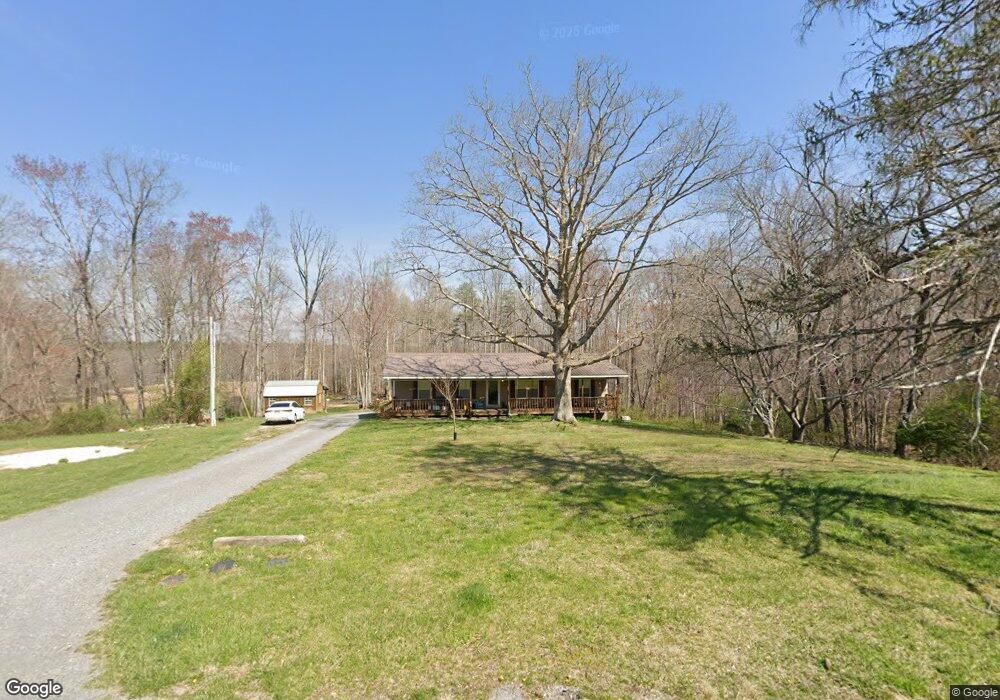
1589 Mccarver Loop Dunlap, TN 37327
Cagle-Fredonia NeighborhoodEstimated Value: $205,000 - $301,000
Studio
2
Baths
1,620
Sq Ft
$148/Sq Ft
Est. Value
About This Home
This home is located at 1589 Mccarver Loop, Dunlap, TN 37327 and is currently estimated at $239,290, approximately $147 per square foot. 1589 Mccarver Loop is a home located in Sequatchie County with nearby schools including Griffith Elementary School, Sequatchie County Middle School, and Sequatchie County High School.
Ownership History
Date
Name
Owned For
Owner Type
Purchase Details
Closed on
Dec 19, 2025
Sold by
Farley Travis
Bought by
Moffitt Tristan Cade
Current Estimated Value
Home Financials for this Owner
Home Financials are based on the most recent Mortgage that was taken out on this home.
Original Mortgage
$206,000
Outstanding Balance
$205,608
Interest Rate
6.25%
Mortgage Type
New Conventional
Estimated Equity
$33,682
Purchase Details
Closed on
Apr 3, 2023
Sold by
Farley Lora
Bought by
Farley Travis
Home Financials for this Owner
Home Financials are based on the most recent Mortgage that was taken out on this home.
Original Mortgage
$152,500
Interest Rate
6.75%
Mortgage Type
New Conventional
Purchase Details
Closed on
Mar 28, 2005
Sold by
Stephenson Farley
Bought by
Travis Farley
Purchase Details
Closed on
Jul 19, 2000
Sold by
Wade Farley and Wade Linda Wife
Bought by
Stephenson Farley
Purchase Details
Closed on
Jul 20, 1993
Bought by
Farley Wade and Wife Linda
Create a Home Valuation Report for This Property
The Home Valuation Report is an in-depth analysis detailing your home's value as well as a comparison with similar homes in the area
Home Values in the Area
Average Home Value in this Area
Purchase History
| Date | Buyer | Sale Price | Title Company |
|---|---|---|---|
| Moffitt Tristan Cade | $206,000 | None Listed On Document | |
| Farley Travis | -- | -- | |
| Travis Farley | $2,000 | -- | |
| Stephenson Farley | $7,000 | -- | |
| Farley Wade | $16,800 | -- |
Source: Public Records
Mortgage History
| Date | Status | Borrower | Loan Amount |
|---|---|---|---|
| Open | Moffitt Tristan Cade | $206,000 | |
| Previous Owner | Farley Travis | $152,500 |
Source: Public Records
Tax History
| Year | Tax Paid | Tax Assessment Tax Assessment Total Assessment is a certain percentage of the fair market value that is determined by local assessors to be the total taxable value of land and additions on the property. | Land | Improvement |
|---|---|---|---|---|
| 2025 | $942 | $51,300 | $4,350 | $46,950 |
| 2024 | $942 | $51,300 | $4,350 | $46,950 |
| 2023 | $942 | $51,300 | $4,350 | $46,950 |
| 2022 | $738 | $30,200 | $2,475 | $27,725 |
| 2021 | $738 | $30,200 | $2,475 | $27,725 |
| 2020 | $738 | $30,200 | $2,475 | $27,725 |
| 2019 | $738 | $30,200 | $2,475 | $27,725 |
| 2018 | $738 | $30,200 | $2,475 | $27,725 |
| 2017 | $687 | $28,125 | $2,475 | $25,650 |
| 2016 | $722 | $28,100 | $3,300 | $24,800 |
| 2015 | $722 | $28,100 | $3,300 | $24,800 |
| 2014 | $722 | $28,100 | $3,300 | $24,800 |
Source: Public Records
Map
Nearby Homes
- 13 Bear Wallow Rd
- Lot 13 Bear Wallow Rd
- 408 Sherman Rd
- 60 Laurel Ridge
- 0 Woods Rd Unit RTC3042786
- 0 Woods Rd Unit 1523709
- 10 Laurel Brook Rd
- 13 N Greenfields Way
- Lot 11 Green Forest Rd
- 175 Twitty Rd
- 0 Echo Point Rd Unit 1525258
- 0 Echo Point Rd Unit 98
- 0 Echo Point Rd Unit RTC2921346
- 0 Echo Point Rd Unit 1515170
- 11556 R 8
- 0 S R 8
- 1368 Bennie Camp Rd
- 1211 Stooping Oak Rd W
- 1231 Black Mountain Rd
- 218 Black Mountain Rd W
- 1630 Mccarver Loop
- 1555 Mccarver Loop
- 1655 McCarver Loop Rd
- 1655 Mccarver Loop
- 1655 Mccarver Loop
- 554 Tate Hill Rd
- 1792 Mccarver Loop
- 1861 McCarver Loop Rd
- 682 Tate Hill Rd
- 575 Tate Hill Rd
- 559 Tate Hill Rd
- 1814 Mccarver Loop
- 0 Tate Hill Rd Unit 1308030
- 0 Tate Hill Rd Unit RTC2718867
- 0 Tate Hill Rd Unit 1352315
- 0 Tate Hill Rd Unit RTC2351325
- 0 Tate Hill Rd
- 1861 Mccarver Loop
- 1965 Mccarver Loop
- 1223 Mccarver Loop
Your Personal Tour Guide
Ask me questions while you tour the home.