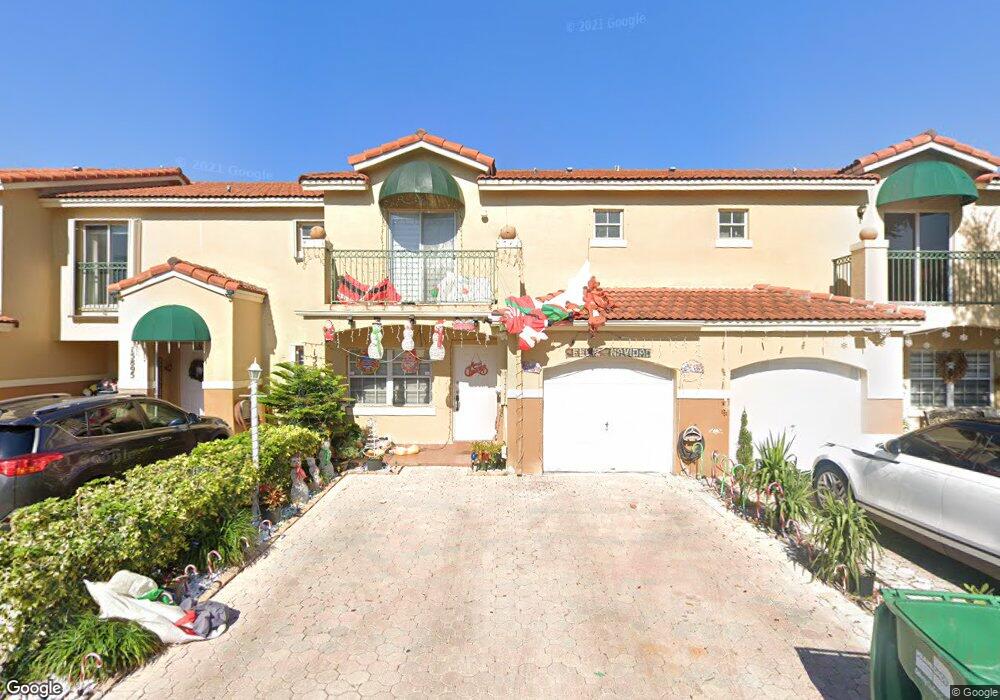
15891 SW 68th Terrace Miami, FL 33193
West Kendall NeighborhoodEstimated Value: $473,000 - $516,000
3
Beds
3
Baths
1,840
Sq Ft
$267/Sq Ft
Est. Value
About This Home
This home is located at 15891 SW 68th Terrace, Miami, FL 33193 and is currently estimated at $492,039, approximately $267 per square foot. 15891 SW 68th Terrace is a home located in Miami-Dade County with nearby schools including Bowman Ashe/Doolin K-8 Academy, Lamar Louise Curry Middle School, and John A. Ferguson Senior High School.
Ownership History
Date
Name
Owned For
Owner Type
Purchase Details
Closed on
Mar 6, 2024
Sold by
Suarez Adain and Suarez Maritza
Bought by
Suarez Maritze and Suarez Marisely
Current Estimated Value
Purchase Details
Closed on
Jan 3, 2008
Sold by
Hsbc Bank Usa Na
Bought by
Suarez Adain and Perez Maritza
Home Financials for this Owner
Home Financials are based on the most recent Mortgage that was taken out on this home.
Original Mortgage
$219,000
Interest Rate
6.12%
Mortgage Type
Purchase Money Mortgage
Purchase Details
Closed on
Mar 20, 2007
Sold by
Bombiela Luis E
Bought by
Bombiela Luis E and Bombiela Diana
Purchase Details
Closed on
Nov 10, 1997
Sold by
Adrian Developers Corp
Bought by
Bombiela Luis E
Home Financials for this Owner
Home Financials are based on the most recent Mortgage that was taken out on this home.
Original Mortgage
$110,787
Interest Rate
7.31%
Mortgage Type
FHA
Create a Home Valuation Report for This Property
The Home Valuation Report is an in-depth analysis detailing your home's value as well as a comparison with similar homes in the area
Home Values in the Area
Average Home Value in this Area
Purchase History
| Date | Buyer | Sale Price | Title Company |
|---|---|---|---|
| Suarez Maritze | -- | None Listed On Document | |
| Suarez Maritze | -- | None Listed On Document | |
| Suarez Adain | $219,000 | Attorney | |
| Bombiela Luis E | -- | Attorney | |
| Bombiela Luis E | $110,900 | -- |
Source: Public Records
Mortgage History
| Date | Status | Borrower | Loan Amount |
|---|---|---|---|
| Previous Owner | Suarez Adain | $219,000 | |
| Previous Owner | Bombiela Luis E | $110,787 |
Source: Public Records
Tax History Compared to Growth
Tax History
| Year | Tax Paid | Tax Assessment Tax Assessment Total Assessment is a certain percentage of the fair market value that is determined by local assessors to be the total taxable value of land and additions on the property. | Land | Improvement |
|---|---|---|---|---|
| 2025 | $2,648 | $159,088 | -- | -- |
| 2024 | $2,435 | $154,605 | -- | -- |
| 2023 | $2,435 | $150,102 | $0 | $0 |
| 2022 | $2,319 | $145,731 | $0 | $0 |
| 2021 | $2,283 | $141,487 | $0 | $0 |
| 2020 | $2,256 | $139,534 | $0 | $0 |
| 2019 | $2,206 | $136,397 | $0 | $0 |
| 2018 | $2,093 | $133,854 | $0 | $0 |
| 2017 | $2,078 | $131,101 | $0 | $0 |
| 2016 | $2,031 | $128,405 | $0 | $0 |
| 2015 | $2,051 | $127,513 | $0 | $0 |
| 2014 | $2,073 | $126,501 | $0 | $0 |
Source: Public Records
Map
Nearby Homes
- 7081 SW 158th Ct
- 15863 SW 71st St
- 6630 SW 159th Place
- 6742 SW 157th Ct
- 15974 SW 71st Terrace
- 12790 SW 157th Ave
- 15809 SW 65th Terrace
- 7045 SW 161st Place
- 6437 SW 158th Pass
- 7251 SW 158th Place
- 6420 SW 157th Place
- 16173 SW 72nd Terrace
- 15802 SW 63rd Terrace
- 16032 SW 63rd Terrace
- 16258 SW 68th Terrace
- 16063 SW 63rd Terrace
- 6681 SW 155th Ave
- 7307 SW 162nd Place
- 6474 SW 152nd Circle Place Unit 14-74
- 7451 SW 157th Ct
- 15895 SW 68th Terrace
- 15887 SW 68th Terrace
- 15883 SW 68th Terrace
- 15899 SW 68th Terrace
- 6834 SW 158th Pass
- 6833 SW 158th Pass
- 15875 SW 68th Terrace
- 6841 SW 158th Pass
- 6850 SW 158th Pass
- 15887 SW 68 Te
- 15871 SW 68th Terrace
- 15871 SW 68th Terrace
- 15879 SW 68th Terrace
- 6849 SW 158th Pass
- 6858 SW 158th Pass
- 6857 SW 158th Pass
- 15867 15867 Sw 68th Ter # 0
- 15867 SW 68th Terrace
- 15867 SW 68th Terrace
- 6866 SW 158th Pass Unit 1