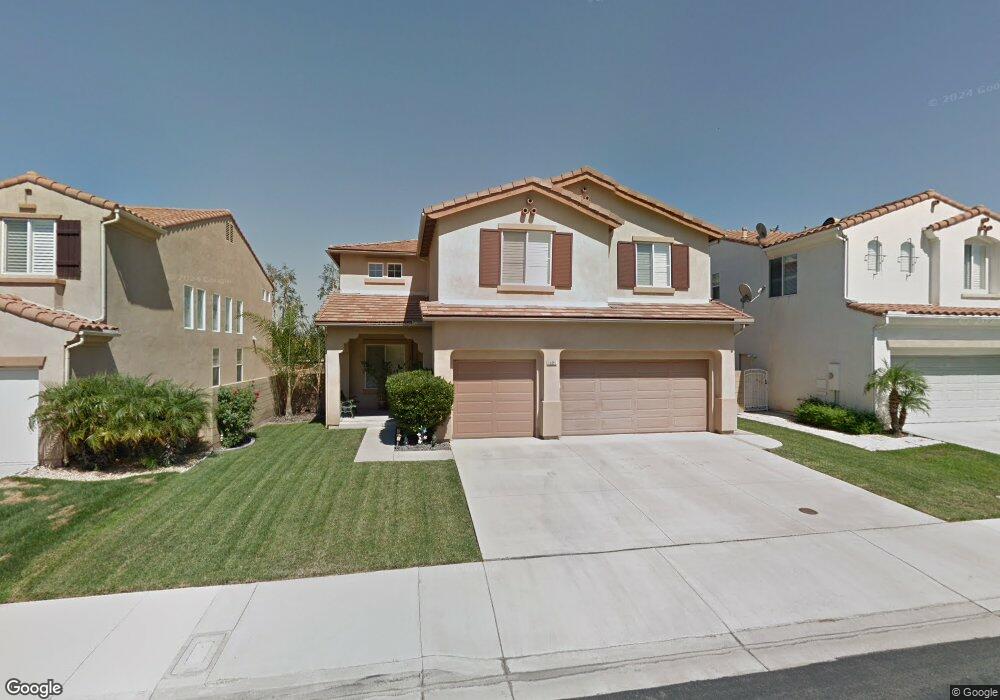
15897 Tanberry Dr Chino Hills, CA 91709
Los Serranos NeighborhoodEstimated Value: $1,096,237 - $1,257,000
4
Beds
3
Baths
2,729
Sq Ft
$431/Sq Ft
Est. Value
About This Home
This home is located at 15897 Tanberry Dr, Chino Hills, CA 91709 and is currently estimated at $1,175,809, approximately $430 per square foot. 15897 Tanberry Dr is a home located in San Bernardino County with nearby schools including Michael G. Wickman Elementary School, Robert O. Townsend Junior High School, and Chino Hills High School.
Ownership History
Date
Name
Owned For
Owner Type
Purchase Details
Closed on
Oct 3, 2023
Sold by
Callier Denine C
Bought by
Denine Callier Living Trust and Callier
Current Estimated Value
Purchase Details
Closed on
Aug 2, 2001
Sold by
Callier Mark W
Bought by
Callier Mark W and Callier Denine C
Home Financials for this Owner
Home Financials are based on the most recent Mortgage that was taken out on this home.
Original Mortgage
$50,000
Interest Rate
7.1%
Mortgage Type
Stand Alone Second
Purchase Details
Closed on
Apr 17, 2000
Sold by
Lennar Homes Of California Inc
Bought by
Callier Mark W and Jackson Denine C
Home Financials for this Owner
Home Financials are based on the most recent Mortgage that was taken out on this home.
Original Mortgage
$237,000
Interest Rate
8.08%
Create a Home Valuation Report for This Property
The Home Valuation Report is an in-depth analysis detailing your home's value as well as a comparison with similar homes in the area
Home Values in the Area
Average Home Value in this Area
Purchase History
| Date | Buyer | Sale Price | Title Company |
|---|---|---|---|
| Denine Callier Living Trust | -- | None Listed On Document | |
| Callier Mark W | -- | North American Title Co | |
| Callier Mark W | $296,500 | Chicago Title |
Source: Public Records
Mortgage History
| Date | Status | Borrower | Loan Amount |
|---|---|---|---|
| Previous Owner | Callier Mark W | $50,000 | |
| Previous Owner | Callier Mark W | $237,000 | |
| Closed | Callier Mark W | $44,400 |
Source: Public Records
Tax History Compared to Growth
Tax History
| Year | Tax Paid | Tax Assessment Tax Assessment Total Assessment is a certain percentage of the fair market value that is determined by local assessors to be the total taxable value of land and additions on the property. | Land | Improvement |
|---|---|---|---|---|
| 2025 | $6,701 | $455,351 | $159,375 | $295,976 |
| 2024 | $6,701 | $446,423 | $156,250 | $290,173 |
| 2023 | $6,529 | $437,669 | $153,186 | $284,483 |
| 2022 | $6,464 | $429,087 | $150,182 | $278,905 |
| 2021 | $6,337 | $420,673 | $147,237 | $273,436 |
| 2020 | $6,242 | $416,359 | $145,727 | $270,632 |
| 2019 | $6,128 | $408,195 | $142,870 | $265,325 |
| 2018 | $5,996 | $400,192 | $140,069 | $260,123 |
| 2017 | $5,885 | $392,346 | $137,323 | $255,023 |
| 2016 | $5,571 | $384,653 | $134,630 | $250,023 |
| 2015 | $5,459 | $378,875 | $132,608 | $246,267 |
| 2014 | $5,350 | $371,453 | $130,010 | $241,443 |
Source: Public Records
Map
Nearby Homes
- 15892 Tanberry Dr
- 15849 Tanberry Dr
- 15906 Kingston Rd
- 15946 Ellington Way
- 15920 Ellington Way
- 15841 Ellington Way
- 5165 Pomona Rincon Rd
- 5177 Pomona Rincon Rd
- 0 Pomona Rincon Rd Unit TR19286701
- 15508 Quail St
- 4570 Willow Bend Ct
- 5142 Cellini Dr
- 4718 El Molino Ln
- 4479 Saint Andrews Dr
- 15597 Timberidge Ln
- 5521 Stargaze St
- 16349 Misty Hill Dr
- 4441 Los Serranos Blvd
- 15366 Carmelita Ave
- 16340 Willowmist Ct
- 15905 Tanberry Dr
- 15889 Tanberry Dr
- 15881 Tanberry Dr
- 15913 Tanberry Dr
- 15908 Tanberry Dr
- 15900 Tanberry Dr
- 15873 Tanberry Dr
- 15916 Tanberry Dr
- 15866 Silver Springs Dr
- 15872 Silver Springs Dr
- 15860 Silver Springs Dr
- 15878 Silver Springs Dr
- 15924 Tanberry Dr
- 15884 Tanberry Dr
- 15854 Silver Springs Dr
- 15865 Tanberry Dr
- 15884 Silver Springs Dr
- 15848 Silver Springs Dr
- 15876 Tanberry Dr
- 15857 Tanberry Dr