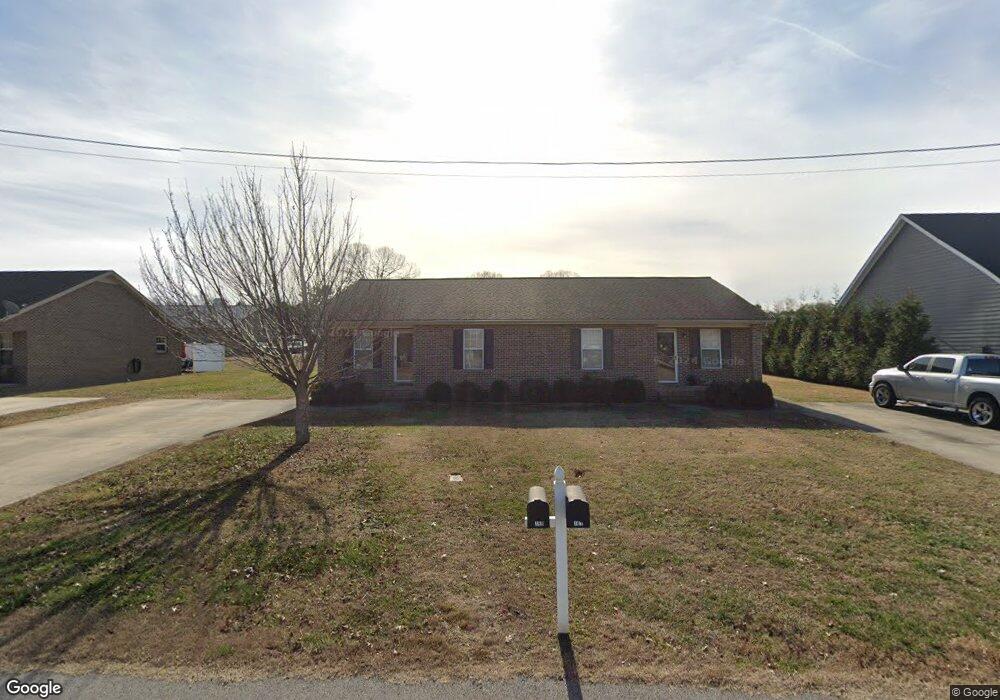
159 13th Ave NW Unit 161 Winchester, TN 37398
Estimated Value: $273,000 - $346,000
--
Bed
2
Baths
2,073
Sq Ft
$147/Sq Ft
Est. Value
About This Home
This home is located at 159 13th Ave NW Unit 161, Winchester, TN 37398 and is currently estimated at $305,322, approximately $147 per square foot. 159 13th Ave NW Unit 161 is a home located in Franklin County with nearby schools including South Middle School, Franklin County High School, and Winchester Christian Academy.
Ownership History
Date
Name
Owned For
Owner Type
Purchase Details
Closed on
Jul 30, 2013
Sold by
Philpott Don
Bought by
Chamberlin Lisa
Current Estimated Value
Purchase Details
Closed on
Dec 28, 2004
Sold by
Sanders Robert
Bought by
Philpott Don
Purchase Details
Closed on
Jul 22, 2002
Sold by
Reynolds David B
Bought by
Sanders Robert
Purchase Details
Closed on
May 12, 1997
Sold by
Manning Sue
Bought by
Foster Ricky D and Foster Gayle
Create a Home Valuation Report for This Property
The Home Valuation Report is an in-depth analysis detailing your home's value as well as a comparison with similar homes in the area
Home Values in the Area
Average Home Value in this Area
Purchase History
| Date | Buyer | Sale Price | Title Company |
|---|---|---|---|
| Chamberlin Lisa | $110,000 | -- | |
| Philpott Don | $375,000 | -- | |
| Sanders Robert | $90,000 | -- | |
| Foster Ricky D | $9,500 | -- |
Source: Public Records
Tax History Compared to Growth
Tax History
| Year | Tax Paid | Tax Assessment Tax Assessment Total Assessment is a certain percentage of the fair market value that is determined by local assessors to be the total taxable value of land and additions on the property. | Land | Improvement |
|---|---|---|---|---|
| 2024 | -- | $76,600 | $7,800 | $68,800 |
| 2023 | $1,969 | $76,600 | $7,800 | $68,800 |
| 2022 | $1,931 | $76,600 | $7,800 | $68,800 |
| 2021 | $1,183 | $76,600 | $7,800 | $68,800 |
| 2020 | $1,633 | $46,200 | $5,400 | $40,800 |
| 2019 | $1,633 | $46,200 | $5,400 | $40,800 |
| 2018 | $1,539 | $46,200 | $5,400 | $40,800 |
| 2017 | $1,539 | $46,200 | $5,400 | $40,800 |
| 2016 | $1,390 | $41,760 | $5,400 | $36,360 |
| 2015 | $1,365 | $41,760 | $5,400 | $36,360 |
| 2014 | $1,365 | $41,764 | $0 | $0 |
Source: Public Records
Map
Nearby Homes
- 124 Barefoot Way
- 111 Barefoot Way
- 114 11th Ave NW
- 1108 N Jefferson St
- 74 Summerlake Ct
- 0 Summerlake Ct Unit RTC2936678
- 0 Summerlake Ct Unit RTC2936679
- 0 Summerlake Ct Unit RTC2936676
- 0 Summerlake Ct Unit RTC2936675
- 0 Summerlake Ct Unit RTC2936677
- 0 Summerlake Ct Unit RTC2936673
- 0 Summerlake Ct Unit RTC2936674
- 906 N High St
- 1000 N Vine St
- 715 N High St
- 713 N Vine St
- 706 N Vine St
- 0 Lakeview Way
- 279 Hammock Ct
- 13 Lake Life Ct
- 161 13th Ave NW
- 163 13th Ave NW
- 155 13th Ave NW Unit 157
- 136 12th Ave NW Unit 138
- 140 12th Ave NW Unit 142
- 146 12th Ave NW Unit 148
- 158 13th Ave NW Unit 160
- 132 12th Ave NW Unit 134
- 169 13th Ave NW
- 162 13th Ave NW Unit 164
- 154 13th Ave NW Unit 156
- 151 13th Ave NW Unit 153
- 0 12th Ave NW
- 150 12th Ave NW Unit 152
- 166 13th Ave NW Unit 168
- 128 12th Ave NW Unit 130
- 150 13th Ave NW Unit 152
- 137 12th Ave NW
- 137 12th Ave NW Unit 139
- 173 13th Ave NW